

The Food Price Index of the United Nations Food and Agriculture Organization (FAO) averaged 133.9 points in October 2026, 1.6 points or 1.2% below the revised September level, according to data FAO published on 6 November. The cereal, dairy and meat price indices fell, the vegetable oil price index rose marginally, and the sugar price index rose 6.6% in one month. Compared with October 2025 the overall index was 5.9% higher, but it remained 16.4% below its March 2022 peak.
The FAO index fell 1.2% and September was revised down
The October fall ended three consecutive monthly increases, from July to September, and brought the index close to its August level, according to FAO's monthly data. With the new release FAO revised September from 136.0 to 135.6 points. September had first been reported as a third consecutive monthly increase and level with November 2022, but it now stands 0.4 points below that month's 136.0 points.
Of the five indices that make up the overall index, only sugar and vegetable oils rose in October. The cereal price index fell the most, by 4.5%, while the dairy and meat price indices fell by about 1%. Over twelve months the picture is different, as the sugar price index is 28.8% higher than in October 2025, vegetable oils 17.6% higher and cereals 12.6% higher, while dairy is 16.9% lower.
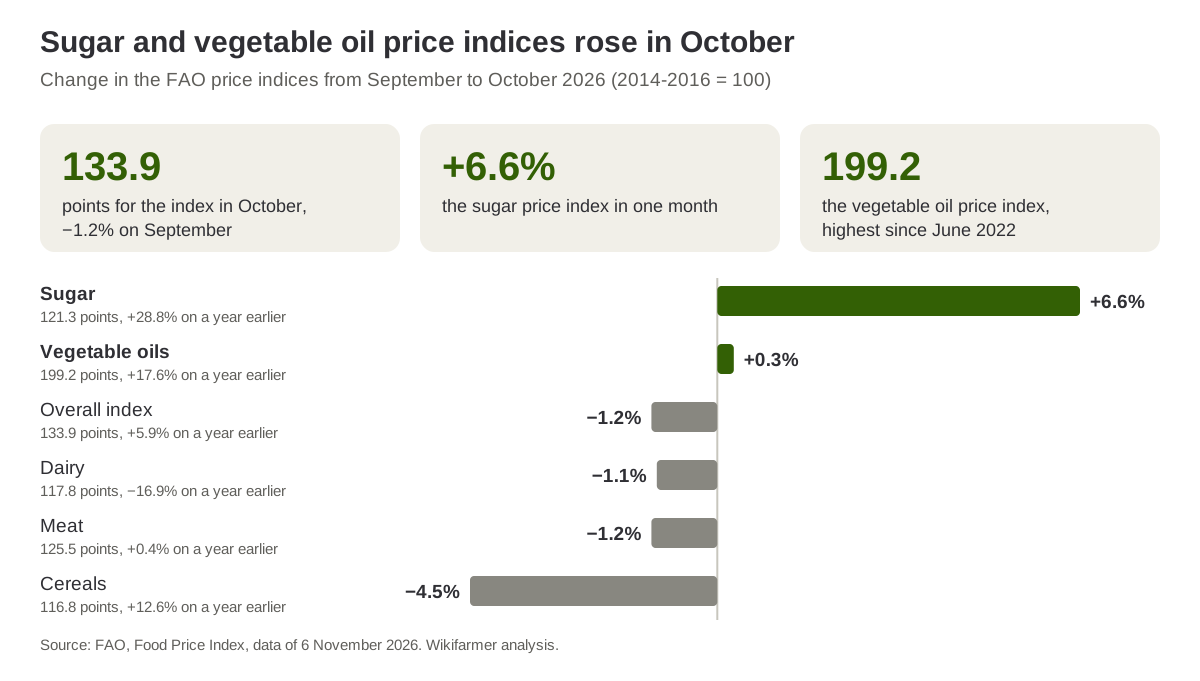
Source: FAO, Food Price Index, data of 6 November 2026 (2014-2016 = 100). Wikifarmer analysis.
The sugar price index rose for a fourth month to its highest level since November 2024
The sugar price index reached 121.3 points, 6.6% above September and 28.8% above October 2025, its fourth consecutive monthly increase. FAO attributes the rise mainly to rains that disrupted sugarcane harvesting and crushing in Brazil's Centre-South, the country's main producing region. Concerns over production in India, after below-normal and unevenly distributed monsoon rainfall, and forecasts of lower production in the European Union and Thailand in the 2026/27 season added to the increase.
The 2026 rise started from a low level, since the index stood at 90.0 points in June. Price history shows that after 18 sugar price surges since 1960 the price was higher six months later in 13, while one year later it was higher in only 7.
The vegetable oil price index reached its highest level since June 2022
The vegetable oil price index averaged 199.2 points, only 0.3% above September but 17.6% above a year earlier, its highest level since June 2022. The small rise came mainly from higher soybean and sunflower oil prices, which more than offset lower rapeseed oil prices, according to FAO. World soybean oil prices reached their highest level since late 2022, with firm demand from the biofuel sector and seasonally declining supplies from South America, while sunflower oil prices rebounded from multi-month lows as export availabilities from the Black Sea region remained tight amid continuing logistical disruptions.
Palm oil prices were almost unchanged during the month but stayed well above year-earlier levels, supported by import demand, better price competitiveness against other vegetable oils and expectations of lower production in Southeast Asia in the 2026/27 season, according to FAO. Palm oil also has a historical record here, since palm oil prices rose after six of the last seven strong El Niño episodes. Rapeseed oil prices, by contrast, fell as supplies increased seasonally and demand for biodiesel feedstocks was lower than expected, particularly in the European Union.
International wheat prices fell after four months of increases
The cereal price index averaged 116.8 points, 4.5% below September. Wheat prices fell after four monthly increases, mainly because of subdued international demand and a better production outlook, particularly in Argentina, according to FAO, while expectations of easing constraints on Black Sea export flows added to the decline. Continuing logistical disruptions in the region limited the fall. International maize prices also eased after reaching a three-year high in September, because of harvest pressure in the United States, expectations of ample supplies from South America and renewed prospects of easing tensions in the Black Sea region.
Barley and sorghum prices followed wheat and maize down, with favourable crop prospects in Australia adding to the fall in barley prices. The rice price index moved the other way, up 1.6%, as harvest delays in some exporting countries added to the effects of adverse weather and rising costs. Despite the monthly fall, the cereal price index is still 12.6% higher than in October 2025, and in Europe EU milling wheat prices in October were above a year earlier in all markets with complete data.
Butter and cheese prices pulled the dairy price index down
The dairy price index averaged 117.8 points, 1.1% below September and 16.9% below October 2025. Over twelve months skim milk powder prices rose 45.8%, while butter and cheese prices fell 31.1% and 29.3% respectively, and whole milk powder prices were broadly unchanged, according to FAO. Butter and cheese prices fell because of ample supplies and subdued buying interest, particularly in the European Union, where butter stocks are high and cheese supplies ample despite signs that growth in milk production is slowing. Competitive export supplies from the United States added to the decline.
Skim milk powder prices rose markedly across the major exporting regions, supported by sustained import demand and limited supplies available for prompt delivery. In the United States, strong demand for nonfat dry milk and the use of milk solids for higher-value dairy protein products tightened powder availability, even though milk supplies are ample overall. The same split shows in EU prices, where EU butter costs only 1.22 times as much as skimmed milk powder.
The meat price index fell as prices declined for three of the four meat types
The meat price index averaged 125.5 points, 1.2% below September and slightly above October 2025. According to FAO, pig meat prices fell, led by lower prices in the European Union, where abundant supplies and limited export opportunities continued to weigh on prices amid subdued international demand. Ovine meat prices retreated further from record highs because of larger seasonal supplies in Australia and currency movements, but remained well above year-earlier levels because export availability is tight.
Bovine meat prices eased slightly, with lower Australian prices amid stronger competition in world markets, while widespread rainfall that encouraged farmers to hold on to cattle reduced supplies and gave prices some support. Brazilian bovine prices were broadly stable, as tighter export availability and stronger demand from the United States offset weaker buying interest from China. Poultry prices were little changed, and Brazilian export prices were largely unchanged despite import restrictions that some trading partners imposed after outbreaks of Newcastle disease, first detected in the state of Santa Catarina on 18 October. Regionalisation arrangements with major trading partners limited the disruption to trade.
FAO forecasts a 3.3% contraction in world cereal trade
In its monthly Cereal Supply and Demand Brief, released the same day, FAO forecasts world cereal production at 2,999 million tonnes in 2026, below the 2025 record but the second highest on record (FAO). Production is expected to fall for all major cereals, most of all for wheat, while rice production is set to fall for the first time in four seasons, by 2.5% to 552.0 million tonnes, largely because of poor producer margins and adverse weather linked to El Niño.
World cereal trade in 2026/27 is forecast at 507.7 million tonnes, 17.4 million tonnes or 3.3% less than in the previous season, mainly because wheat trade is falling by 18.1 million tonnes or 8.6%, with lower shipments from all major exporters. Maize trade, by contrast, is expected to grow by 2.2%, supported by large exportable supplies in Argentina. World cereal stocks are forecast to rise by 17.2 million tonnes by the close of the seasons in 2027, mainly because of larger wheat stocks in Russia and Ukraine, where export disruptions are contributing to an accumulation of supplies, at a time when Russian wheat exports are heading for their lowest level in five years. The stocks-to-use ratio is forecast at 32.4%, slightly above the previous season.
International prices matter differently at each stage of the chain
The FAO index measures international prices of a basket of basic food commodities, not producer or retail prices in any one country. Growers of sugar beet, sugarcane and oil crops are selling into markets where the international sugar and vegetable oil price indices were 28.8% and 17.6% above a year earlier in October. For dairy farmers the picture depends on the product their milk goes into, since milk powder and butter prices are moving in opposite directions. For feed buyers, international wheat and maize prices fell in October, while the cereal price index remains above last year's level.
As for consumer prices, EU food prices follow world prices late and only to a small extent. The next FAO Food Price Index will be published on 4 December 2026, according to FAO's release calendar, and the biannual Food Outlook, with a more detailed analysis of cereal markets, is due on 19 November.
Frequently asked questions
What was the FAO Food Price Index in October 2026? It averaged 133.9 points, 1.2% below the revised September level and 5.9% above October 2025. It was the first monthly fall after three months of increases.
Why did the sugar price index rise? Mainly because rains disrupted sugarcane harvesting and crushing in Brazil's Centre-South, according to FAO, along with concerns over production in India and forecasts of lower production in the European Union and Thailand. The index rose for a fourth consecutive month and is 28.8% above a year earlier.
Why did cereal prices fall? Wheat prices fell because of subdued demand, a better production outlook in Argentina and expectations of easing constraints in the Black Sea, and maize prices because of the US harvest and expected ample supplies from South America, according to FAO. The rice price index was the exception, up 1.6%.
Why is the dairy price index so much lower than a year ago? The index is 16.9% below a year earlier because butter and cheese prices are 31.1% and 29.3% lower, while skim milk powder prices are 45.8% higher, according to FAO.
When is the next index published? FAO will publish the November index on 4 December 2026.
Important notes
The FAO index covers international commodity prices, not producer or retail prices in any country. Monthly and annual changes and the "highest since" comparisons were calculated by Wikifarmer from FAO's data file of 6 November 2026 and confirmed by an independent recalculation. FAO's release text says the cereal price index was 13.1 points below October 2025, while FAO's data table shows 116.8 points in October 2026 against 103.8 a year earlier, which is 12.6% higher, and this article follows the table. The meat price index for the latest months is partly based on projected prices and can be revised significantly, as happened with September. For sugar, FAO's release says "highest level since December 2024", meaning higher than every month since then, which is the same as this article's "highest since November 2024". The causes of the changes are attributed as FAO states them.
Sources
- FAO. (2026, 6 November). FAO Food Price Index. Food and Agriculture Organization of the United Nations.
- FAO. (2026, 6 November). FAO Food Price Index, nominal and real indices from 1990 (dataset). Food and Agriculture Organization of the United Nations.
- FAO. (2026, 6 November). FAO Cereal Supply and Demand Brief. Food and Agriculture Organization of the United Nations.