
In the 18 surges in the sugar price from 1960 to 2023, meaning rises of 30% or more within seven months, the price was higher six months later in 13 of the 18, while one year later it was higher in only 7 and lower in 9, according to a Wikifarmer analysis of World Bank monthly commodity prices. September 2026 became the 19th surge month in the series, as the average monthly world sugar price rose by about a third from February, while raw sugar futures in New York closed October with a gain of 9.8%, according to Reuters.
The sugar price rose about 32% from February to September 2026
In February 2026 the world sugar price was 0.31 US dollars per kilogram, or 310 dollars per tonne, its lowest level since December 2020, when it was also 0.31 dollars, and in September it reached 0.41 dollars per kilogram, the highest price since March 2025 (World Bank). The rise comes to about 32%, but the World Bank publishes the price to two decimal places, so the actual change lies somewhere between 29% and 36%. Compared with September 2025 the price was about 17% higher, yet it remained about 29% below the 0.58 dollars of September 2023, the highest monthly price since September 2011.
In October, raw sugar futures on the ICE exchange in New York closed the month with a gain of 9.8%, according to Reuters, which reports that sugar output in Brazil's centre-south region in the first half of October was 27.1% lower than a year earlier, at 1.87 million tonnes, based on figures from the country's agriculture ministry. The rise also showed up in international price indices, as FAO's sugar price index rose in September together with the cereal and vegetable oil indices, while the World Bank's monthly price for October is expected in early November.
Six months after a surge the price was higher in 13 of 18 cases
Before the 2026 surge, the World Bank series records 18 surges, from May 1961 to April 2023. Six months after the surge month the price was higher in 13 and lower in 5, with a median rise of 18.4% over six months, while across all months since 1960 the price was higher six months later in 46.2% of cases, lower in 45.5% and unchanged in the remaining 8.3%. After a surge, therefore, the price stood at a higher level six months later more often than in an ordinary six-month period.
The price was lower six months after the surges of May 1961, April 1967, May 1983, May 1993 and December 2002, with falls ranging from 10.0% to 28.6%. The largest rises followed the surges of November 1962, when the price rose 175.0% within six months, and of October 1979, with a rise of 80.8%.
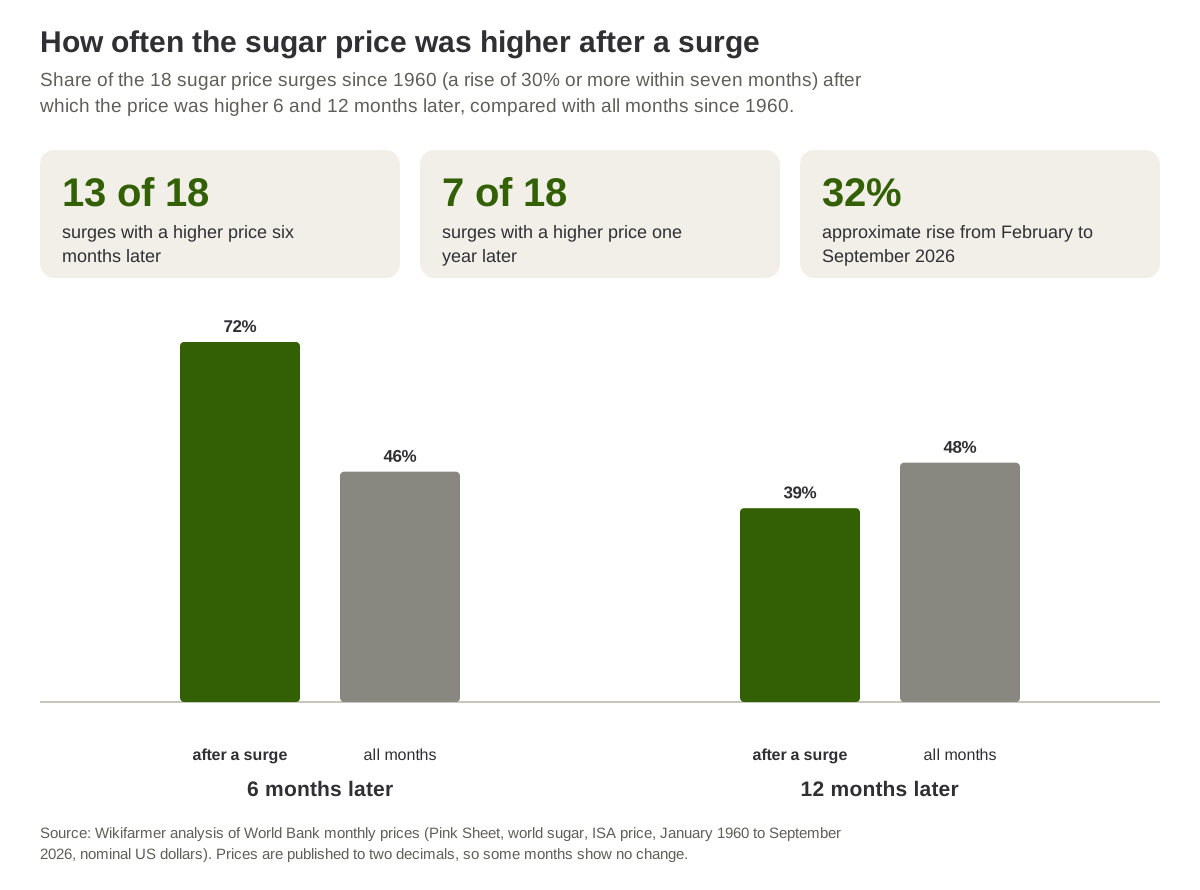
Source: Wikifarmer analysis of World Bank monthly prices (Pink Sheet, update of 2 October 2026). A surge is a rise of 30% or more within seven months.
One year after a surge the price was higher in only 7 of 18 cases
Twelve months after the surge the price was higher in 7 cases, unchanged in 2 and lower in 9, with a median change of a small fall of about 1.4%, while across all months since 1960 the price was higher a year later in 48.0% of cases and lower in 44.6%. After the surges of November 1962 and October 1979 the price more than tripled within a year, but after the surge of May 1983 it fell 40.0%, and after those of August 1989 and December 2002 it fell 22.6% and 22.2% respectively. The most recent surge, in April 2023, was followed by a rise of 7.5% over six months and a fall of 15.1% over a year, while in between, in September 2023, the price reached 0.58 dollars per kilogram.
| Surge month | Price (US dollars per kg) | Rise over 7 months | Change 6 months later | Change 12 months later |
| May 1961 | 0.07 | +40.0% | -28.6% | -14.3% |
| November 1962 | 0.08 | +33.3% | +175.0% | +212.5% |
| April 1967 | 0.05 | +66.7% | -20.0% | -20.0% |
| December 1968 | 0.06 | +50.0% | +33.3% | 0.0% |
| October 1979 | 0.26 | +36.8% | +80.8% | +242.3% |
| May 1983 | 0.20 | +53.8% | -10.0% | -40.0% |
| September 1985 | 0.11 | +37.5% | +36.4% | -9.1% |
| August 1989 | 0.31 | +47.6% | +3.2% | -22.6% |
| May 1993 | 0.26 | +36.8% | -15.4% | 0.0% |
| July 2000 | 0.21 | +61.5% | +9.5% | -9.5% |
| December 2002 | 0.18 | +38.5% | -16.7% | -22.2% |
| August 2004 | 0.17 | +30.8% | +17.6% | +29.4% |
| November 2005 | 0.25 | +31.6% | +48.0% | +4.0% |
| January 2008 | 0.26 | +30.0% | +19.2% | +7.7% |
| May 2009 | 0.35 | +34.6% | +40.0% | -2.9% |
| March 2016 | 0.34 | +36.0% | +38.2% | +17.6% |
| November 2020 | 0.31 | +34.8% | +22.6% | +38.7% |
| April 2023 | 0.53 | +35.9% | +7.5% | -15.1% |
| September 2026 | 0.41 | +32.3% | not yet available | not yet available |
Source: Wikifarmer analysis of World Bank monthly sugar prices (Pink Sheet, update of 2 October 2026), in US dollars per kilogram, not adjusted for inflation. The rise over 7 months compares the price in the surge month with the price seven months earlier. The 6- and 12-month changes are measured from the price in the surge month. Prices are published to two decimal places, so in the older and cheaper years the percentages carry more uncertainty.
A surge is any rise of 30% within seven months
The World Bank series is the daily price of raw sugar calculated under the International Sugar Agreement (ISA), FOB and stowed at greater Caribbean ports, as a monthly average in US dollars per kilogram from January 1960 to September 2026. A surge is any month in which the price was at least 30% higher than seven months earlier, and it counts as a new surge only when no such month occurred in the previous 12 months, so that the same rise is not counted several times. The seven-month span matches the period from February to September 2026.
In the 1960s the price fell as low as 0.03 dollars per kilogram, so rounding to two decimal places distorts the percentages of those years more. From 1970 onwards there are 14 surges, after which the price was higher six months later in 11, while a year later it was higher in 6, unchanged in one and lower in 7. January 2008 sits exactly on the 30% threshold, and without it the price was higher six months later in 12 of the 17 surges. The changes are in dollars of each period, not adjusted for inflation, so the two cases with an unchanged price after 12 months, following the surges of December 1968 and May 1993, correspond to a small fall once inflation is taken into account.
The rise in the world price matters to sugar producers and buyers
The 2026 rise concerns sugarcane growers in Brazil, India and Thailand, sugar beet growers in Europe, refiners and the food and drink manufacturers that buy sugar, as well as the countries that cover their needs through imports. The prices growers receive in each country differ from the world price, because they depend on the currency, transport costs, tariffs and the way the market is organised in each country. In the EU, the average white sugar price recorded by the European Commission was about 500 euros per tonne in August 2026, 6.7% lower than a year earlier, in the year when France's largest producer was projecting the lowest EU sugar output since 1988. The two prices cover a different product and a different market, so they do not always move together.
Reuters links the rains that are slowing the harvest in Brazil to El Niño, while price history gives a mixed picture, as after the seven strong El Niño episodes since 1965 the sugar price was higher a year later in four. In the 18 earlier surges the price stood at a higher level six months later more often than in an ordinary six-month period, while a year later that difference did not appear. The sample is small, and the September 2026 price may still be revised by the World Bank. In the coming months, the progress of the harvest in Brazil's centre-south, the World Bank's October price and the processing of the new sugar beet crop in Europe are worth following. The figures describe what the price did in the past and are not a forecast.
Sources
- World Bank. (2026). Commodity Markets, Pink Sheet monthly prices. World Bank Group.
- European Commission. (2026). Agri-food data portal, API guide (sugar prices). Directorate-General for Agriculture and Rural Development.
- Reuters. (2026, 1 November). Raw sugar gains. Business Recorder.