

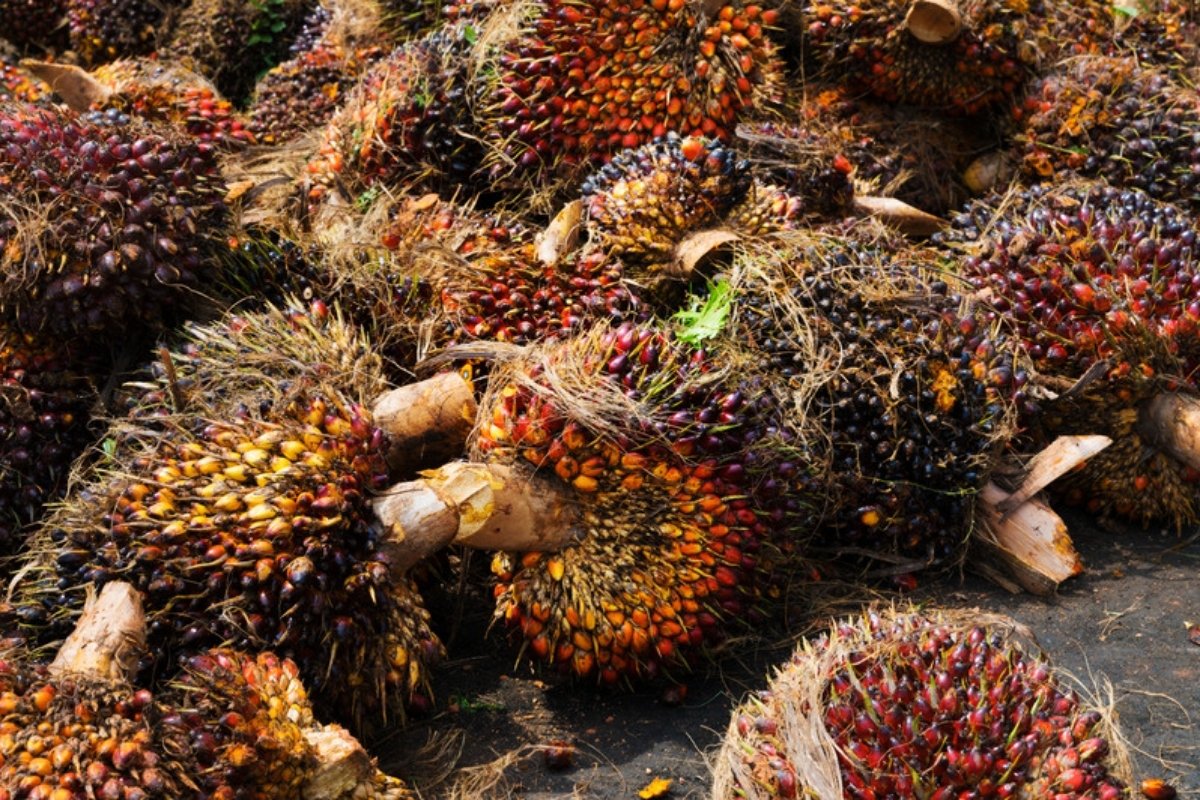
Palm oil prices rose in the 12 months after six of the seven strong El Niño events recorded since 1965, by a median of 33%, according to a Wikifarmer analysis of World Bank monthly prices and the El Niño index of the US National Oceanic and Atmospheric Administration (NOAA). Coconut and soybean oil also rose after six of the seven events, while wheat, maize, coffee and sugar showed no consistent pattern. The record matters this autumn, because the current El Niño has already reached the strong range.
NOAA expects a strong to very strong event this winter
NOAA's Climate Prediction Center kept its El Niño Advisory in place on 8 October 2026. Sea surface temperatures in the Niño-3.4 region of the Pacific were 2.1°C above average in September, and NOAA puts the chance of a strong to very strong El Niño through January to March 2027 above 83% (NOAA CPC, 8 October 2026). The same discussion gives a 54% to 83% chance, depending on the season, that this becomes the strongest event recorded since 1950.
NOAA also reports that rainfall and convection remained suppressed over Indonesia. That matters for food buyers because Indonesia and Malaysia produce most of the world's palm oil, and dry spells there reduce palm yields with a delay. Rainfall shifts of this kind are the main way El Niño affects crops and food supply in producing regions, and they shape the risks the 2026 event poses to crops and food prices.
Seven strong El Niños since 1965 form the test
NOAA's official El Niño index since February 2026 is the Relative Oceanic Niño Index (RONI), a three-month average temperature anomaly. An event counts as strong at +1.5°C or more. The July to September 2026 reading was RONI +1.69°C, which puts the current event in the strong range (NOAA CPC indices).
The World Bank's monthly commodity price series start in 1960 (World Bank Pink Sheet). Since then, RONI first crossed +1.5°C in seven episodes: September 1965, September 1972, September 1982, November 1991, July 1997, December 2009 and August 2015. For each one we measured the change in the World Bank monthly price over the following 12 months, in nominal US dollars. We then compared the result with every 12-month window between 1960 and 2025, so that an ordinary year has a baseline to be judged against.
Three vegetable oils rose after six of seven events
Palm oil rose in the 12 months after six of the seven strong El Niños. The median rise was 33% over 12 months. Across all 12-month windows starting from 1960 to September 2025, palm oil's median change was 1%, its average change 7%, and it rose in only about half of them. The one exception was 1965, when palm oil slipped 2.8%.
Coconut oil and soybean oil also rose in six of seven cases. Coconut oil, which comes mainly from the Philippines and Indonesia, had the largest moves, with a median rise of 53% over 12 months. Soybean oil rose by a median of 14%.
| Product | Strong El Niños followed by a rise | Median 12-month change | Share of all 12-month windows with a rise since 1960 |
| Palm oil | 6 of 7 | +33% | 52% |
| Coconut oil | 6 of 7 | +53% | 54% |
| Soybean oil | 6 of 7 | +14% | 50% |
| Robusta coffee | 4 of 7 | +7% | 50% |
| Sugar | 4 of 7 | +19% | 48% |
| Wheat (US HRW) | 4 of 7 | +2% | 49% |
| Maize | 4 of 7 | +13% | 52% |
| Oranges | 3 of 7 | −6% | 51% |
Source: Wikifarmer analysis of World Bank Pink Sheet monthly prices (nominal US$) and NOAA CPC RONI, October 2026. Event month is the centre month of the first three-month season with RONI at +1.5°C or above.
The vegetable oil results stand out against ordinary years, but seven events cannot settle the question. When we drew 20,000 random sets of seven months from the whole record, a set with an average rise as large as palm oil's turned up only 1% to 2% of the time, and the same was true for coconut and soybean oil. With 1972 left out, that share rises to about 5% for palm and coconut oil and 11% for soybean oil. A run of six rises in seven would also happen by chance in roughly 6% to 10% of random draws. We also tested 20 commodities, so one or two would show a pattern by luck alone. Palm and coconut oil hold up best on every version of the test.
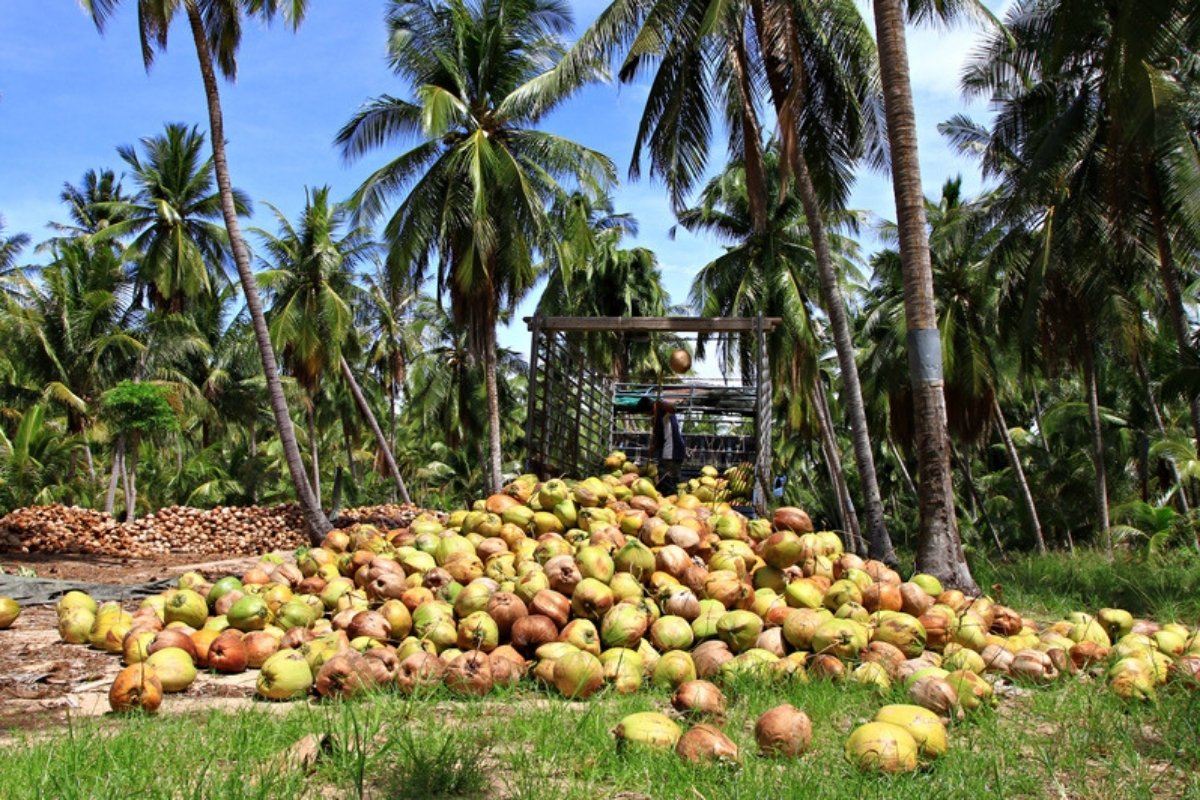
Coconut oil had the largest moves, with a median rise of 53% in the 12 months after strong El Niño events
Other farm commodities show no consistent pattern
Wheat, maize, Robusta and Arabica coffee, sugar, beef and oranges rose after some strong El Niños and fell after others. Each of them rose after three to five of the seven events, close to the share of rises in an ordinary 12-month window. Chicken rose after six of seven, but by a median of only 6%, and chicken prices rise in two thirds of ordinary 12-month windows anyway. Wheat shows a high average rise only because of 1972, when it jumped 149%. Without that year its average falls from 26% to 6% and its median is about 1%. Maize still averages 15% without 1972, but it rose after only three of the remaining six events, with a median of 4%.
Robusta coffee is often linked to El Niño because drought can hit Vietnam and Indonesia. In the World Bank record it rose after four of the seven strong events, with a median gain of 7%, which is in line with any 12-month period. Sugar swung widely, from a 25% fall after 1965 to a 76% rise after 2015, with no consistent direction.
The 1972 boom inflates the averages
The 1972 event coincided with the 1972 to 1974 world food and oil price shock, when palm oil rose 88% and soybean oil 126% within a year. Averages that include 1972 overstate the El Niño effect. With 1972 excluded, palm oil still rose after five of the remaining six events, with a median rise of about 30%. Coconut oil rose after five of six, with a median of 32%.
The result also holds with NOAA's older index, the Oceanic Niño Index (ONI). The ONI adds an eighth strong event, in September 2023, which RONI does not count as strong. On that list palm oil rose after seven of eight events, including an 18% rise after September 2023.
Where vegetable oil prices stand in autumn 2026
RONI crossed +1.5°C in the July to September 2026 season, so August 2026 is the starting month for the current event on our method. The World Bank palm oil price was $1,132 per tonne in August 2026 and $1,180 per tonne in September, a rise of 4% in one month. A year earlier, in September 2025, it was $1,037 per tonne. Soybean oil was $1,615 per tonne in September 2026 and coconut oil $2,083 per tonne (World Bank Pink Sheet, October 2026 release).
Sunflower and rapeseed oil matter most to Mediterranean food manufacturers, but the World Bank series for them are too short for this test, with only two or three strong events each. Other drivers also move vegetable oil prices, including biodiesel mandates, export levies and crude oil prices. Our overview of supply and trade in global vegetable oil markets covers them. Vegetable oils also feed into broader food inflation, at a time when world food prices are back at their November 2022 level.
Seven events are a small sample
The pattern rests on seven events, so a single unusual year shifts the median. The December 2009 event sits exactly at the +1.5°C threshold, so a small revision to the index could remove it from the list. The test uses nominal prices, and the general rise in prices since 1960 is captured by the baseline rather than removed. It shows what happened after past events and does not forecast the size or timing of a move in 2027. Buyers who rely on palm, coconut or soybean oil, directly or through blends and ingredients, can use it as a reason to review cover for 2027 rather than as a price target.
Sources
- NOAA Climate Prediction Center. (2026). ENSO diagnostic discussion, 8 October 2026. NOAA.
- NOAA Climate Prediction Center. (2026). Monthly atmospheric and SST indices, RONI and ONI files. NOAA.
- World Bank. (2026). Commodity markets, Pink Sheet monthly historical prices. World Bank.