


From January 2020 to September 2026, consumer prices for food in the EU rose 36.9% in total, more than the FAO Food Price Index, which rose 32.7%, but the two series moved at very different speeds, according to a Wikifarmer analysis of FAO and Eurostat data. The FAO index peaked in March 2022 and by September 2026 was 15.1% lower, while EU food prices kept rising until April 2026. Since 2007, a 10% change in the FAO index has been associated with a change of only 0.6% to 2.3% in EU food prices within 18 months, depending on the period and the method, with the closest relationship appearing 10 to 12 months later.
EU food prices have risen more than the FAO index since 2020
The FAO Food Price Index, which tracks international prices of cereals, vegetable oils, dairy products, meat and sugar, reached 160.2 points in March 2022, the highest level in the series, and stood at 136.0 points in September 2026 (FAO). The harmonised index of consumer prices for food in the EU27, by contrast, kept rising after 2022, reached its highest point in April 2026 and in September was only 1.1% below it (Eurostat).
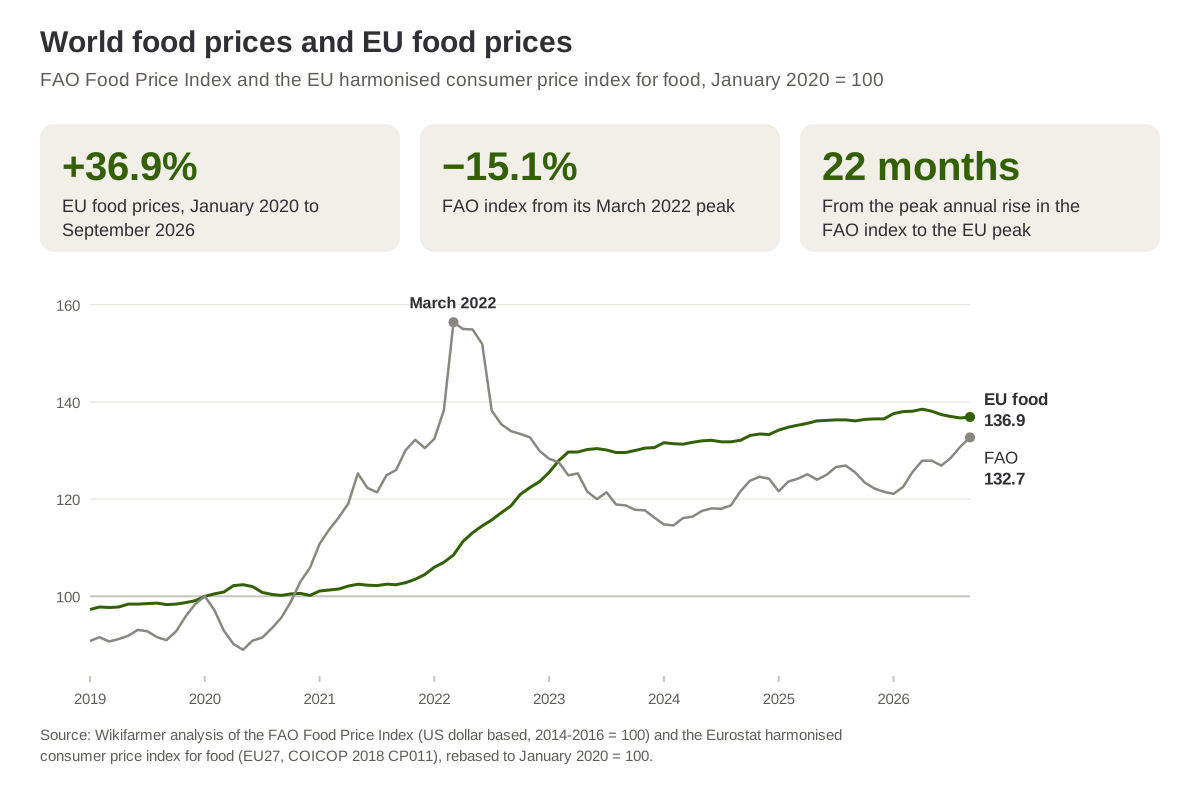
The FAO index and the EU consumer price index for food, with January 2020 equal to 100. Source: Wikifarmer analysis of FAO and Eurostat data.
With January 2020 as the base, the FAO index stood at 132.7 points in September 2026 and EU food prices at 136.9, so EU prices kept almost all of the rise of the period, while the FAO index lost much of it.
The annual rise peaked in the EU 22 months after the FAO index
The annual change in the FAO index reached 40.8% in May 2021, while the annual change in EU food prices peaked at 19.6% in March 2023, 22 months later. The gap is not the same from one cycle to the next: in 2008 the annual rise in the FAO index peaked at 63.2% in March and the EU rise at 7.9% in July, four months later, while in 2011 the EU peak, at 3.9% in May, came one month before the FAO peak, at 40.5% in June.
Only a small part of the FAO change shows up in EU prices
In the monthly data since 2007, a 10% change in the FAO index is associated with a cumulative change of about 0.6% to 2.3% in EU food prices over the following 18 months, depending on the period, where the period starts and ends, and the adjustment for seasonal price patterns. The correlation between the two indices is closest with a lag of 10 months in 2007 to 2019 and 12 months since 2020.
Granger causality tests, which check whether past FAO values help predict EU prices, give a borderline significant result only with a 12-month lag and not with 3 or 6 months, and from 2000 to 2006 no stable relationship appears at all, so the relationship is weak and statistically unstable. Changes in the FAO index are associated with only a small part of the changes in EU food prices.
The FAO index measures international commodity prices
The FAO index is the average of five commodity group price indices, weighted by the average export share of each group in 2014 to 2016, and it reacts quickly to events such as a poor harvest, as when a drought in one major exporting country raises wheat prices everywhere. The Eurostat consumer price index, on the other hand, measures the price households pay for all food, from bread to fresh vegetables, and that price also includes costs beyond the raw commodity, such as processing, packaging, transport and retail. The data show how closely the two indices move together, not which cost explains the difference.
This year's FAO rise had not reached EU prices by September
In September 2026 the FAO index was at the highest level since late 2022 and 5.8% higher than a year earlier, while EU food prices were only 0.6% higher. Based on the lags of previous years, part of this year's rise in the FAO index could show up in EU food prices during 2027, but the relationship is weak and this is not a forecast. The next FAO index will be published on 6 November 2026.
Frequently asked questions
What is the FAO Food Price Index? It is a monthly index of international prices for five food groups, cereals, vegetable oils, dairy products, meat and sugar, with 2014 to 2016 as the base period. In September 2026 it stood at 136.0 points.
How fast do world food prices reach EU shelves? The closest relationship appears with a lag of 10 to 12 months. In the 2021 to 2023 cycle, the annual rise peaked in the EU 22 months after the FAO index.
How much of an international price rise passes through to EU prices? A small part, about 0.6% to 2.3% for every 10% change in the FAO index within 18 months, depending on the period and the method. The relationship is weak and changes from one period to another.
Why did EU food prices not fall along with the FAO index? Processing, packaging, transport and retail are also part of the consumer price, while the FAO index measures only international commodity prices, and the data do not show which of these explains the difference.
Will EU food prices rise after this year's FAO increase? If the relationship of previous years holds, part of the rise could show up during 2027, but the relationship is weak and does not allow a forecast.
Important notes
The analysis is by Wikifarmer, based on the monthly FAO Food Price Index (nominal, 2014-2016 = 100) and the Eurostat harmonised index of consumer prices for food in the EU27 (COICOP 2018, code CP011, 2015 = 100), from December 1999 to September 2026. The relationships were estimated on monthly log changes, with correlations for lags of 0 to 18 months, Granger causality tests with 3, 6 and 12 lags and an 18-month distributed lag model, separately for 2000 to 2006, 2007 to 2019 and from 2020. The cumulative changes were checked with different period boundaries and with seasonal adjustment, and the range of 0.6% to 2.3% covers all of these versions. The FAO index is based on prices in US dollars and was not adjusted for the euro exchange rate. The annual changes in the text are simple percentage changes. The data show correlation, not cause.
Sources
- FAO. (2026). FAO Food Price Index. Food and Agriculture Organization of the United Nations.
- Eurostat. (2026). Harmonised Indices of Consumer Prices (HICP), database. European Commission.