

In the second quarter of 2026 the prices EU farmers received for their products were 5.8% lower than a year earlier, while the prices of energy, fertilisers and the other inputs they used up on the farm were 4.7% higher, according to a Wikifarmer analysis of Eurostat's quarterly agricultural price indices. The ratio of the two indices fell 10.0% in a year, the largest year-on-year fall in the whole 2020-based series, where year-on-year comparisons start in 2021. The figures cover April to June, in a year when fertiliser and energy costs have occupied farmers and EU institutions since the spring.
EU farm product prices fell 5.8% in a year
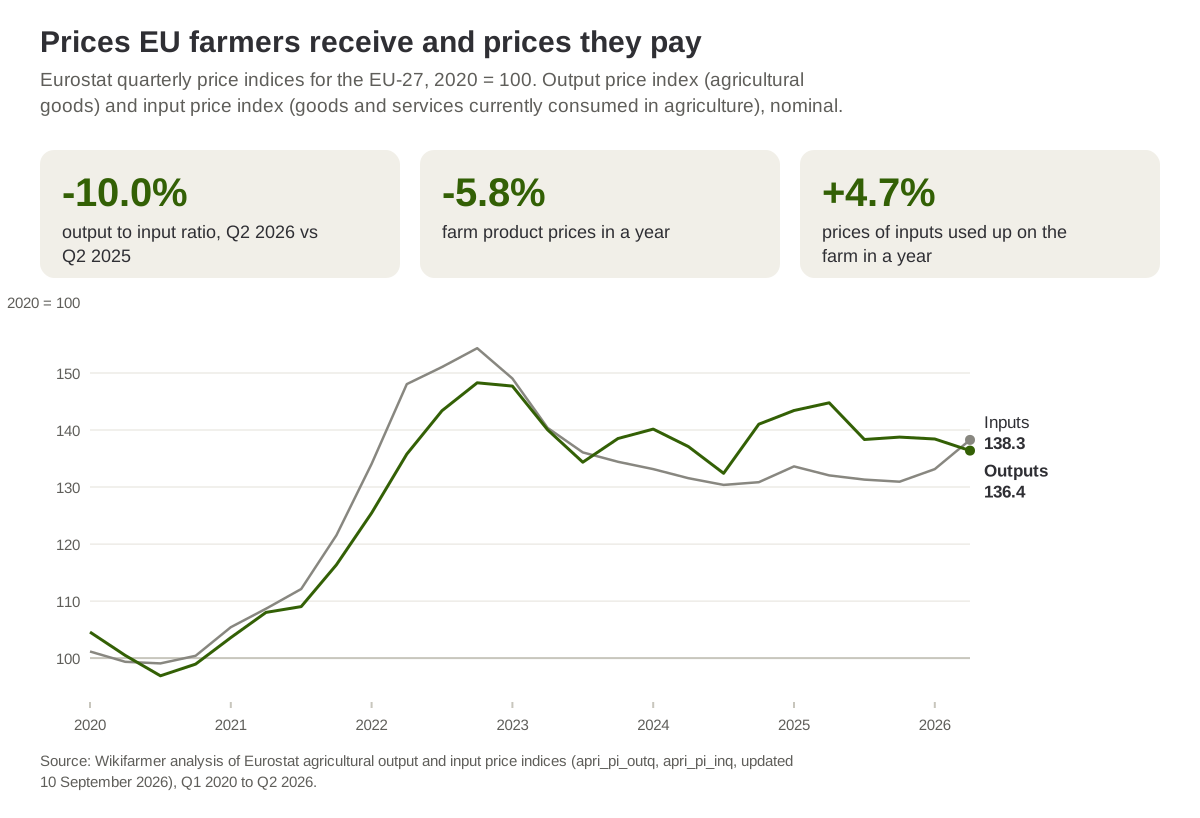
Eurostat's output price index, which tracks the prices at which farmers sell their crop and animal products, stood at 136.38 points for the EU-27 in the second quarter of 2026, with 2020 equal to 100, down from 144.76 in the second quarter of 2025 (Eurostat, apri_pi_outq). Among the product groups potatoes fell the most, with their index 17.1% lower, from 159.70 to 132.34, followed by animal products, down 13.3% in a year, from 160.86 to 139.43. Within animal products the milk index fell 16.6%, in a year when the EU butter price in October was far below its level a year earlier, while the egg index rose 1.7%. Cereal prices were 5.6% lower, with the index down from 122.30 to 115.44, and fruit prices 7.1% lower, while prices of vegetables and horticultural products were 4.3% higher.
Energy prices rose 22.0% and fertiliser prices 13.4%
The input price index for goods and services currently consumed in agriculture, meaning what a farm buys and uses up within the year, such as seeds, energy, fertilisers, plant protection products, feed, veterinary services and maintenance, reached 138.27 points for the EU-27 in the second quarter of 2026, up from 132.03 a year earlier (Eurostat, apri_pi_inq). Prices of energy and lubricants rose 22.0% in a year, with the index up from 146.70 to 178.92, and within that group the motor fuel index rose 33.1% and the electricity index 3.0%. Prices of fertilisers and soil improvers rose 13.4%, from 160.83 to 182.37, the latest value being a Eurostat estimate. Natural gas is the main feedstock for nitrogen fertilisers, yet after sharp rises in European gas prices the urea price was higher three months later in only two of five episodes since 1985.
Seed prices were 0.3% lower and plant protection product prices 0.1% higher, with the second-quarter index for plant protection also a Eurostat estimate, while feed prices were 2.5% lower, with the index down from 128.01 to 124.75, in a year when feed costs keep falling with ample corn.
The output to input ratio is at its lowest since late 2022
Dividing the output index by the input index shows whether, since 2020, the prices farmers receive have risen more or less than the prices they pay for inputs used up on the farm, so a value below 100 means input prices have risen more. For the EU-27 the ratio was 98.63 points in the second quarter of 2026, down from 109.64 a year earlier, which was the highest level since the series began in 2020. Of the 26 quarters from 2020 to the second quarter of 2026, the ratio was lower in only nine, all between the third quarter of 2020 and the fourth quarter of 2022, with a low of 91.71 in the second quarter of 2022, and it was last lower in the fourth quarter of 2022, at 96.07.
Source: Wikifarmer analysis of Eurostat price indices (apri_pi_outq, apri_pi_inq, updated 10 September 2026).
From the fourth quarter of 2023 to the first quarter of 2026 the ratio was above 100 in every quarter, because after its peak in the fourth quarter of 2022 the input index fell further than the output index and from 2024 stayed almost flat, between 130 and 134 points. In the second quarter of 2026 the two indices moved in opposite directions, with outputs falling and inputs rising, and the ratio dropped below 100 again.
In France the ratio is at its lowest since 2020
In France the ratio fell to 95.15 points in the second quarter of 2026, the lowest of all 26 quarters since 2020, as product prices were almost unchanged, down 0.2%, while prices of inputs used up on the farm rose 7.7%. In Germany the ratio was 95.35 points, 13.3% lower than a year earlier, with the output index provisional for the last three quarters. In Italy the ratio fell 6.3% to 99.85 points, while in Spain, down 7.1%, and Greece, down 3.8%, it stayed above its 2020 level, at 111.65 and 115.74 points respectively.
The price ratio matters to anyone planning costs for 2027
The figures concern farmers, cooperatives and advisers drawing up budgets for the next growing season, as they show that over a year input and product prices moved in opposite directions across the EU. On 12 June 2026, within the same quarter, the European Commission proposed €540 million in fertiliser relief, at a time when EU fertiliser prices were 13.4% higher than a year earlier according to the Eurostat index.
The indices measure price changes and not income, so a 10.0% fall in the ratio does not mean farm incomes fell by the same share, since income also depends on the quantities produced, subsidies and costs outside inputs used up on the farm. What happens next will depend on energy and fuel costs in European farming in the coming months and on summer and autumn harvest prices, which will show in the third and fourth quarter 2026 data in Eurostat's next updates.
The analysis uses Eurostat's nominal indices with 2020 equal to 100, as updated on 10 September 2026; the 2015-based indices, which end in the third quarter of 2023, were not linked to them. The output index is total agricultural goods output and the input index covers goods and services currently consumed in agriculture, excluding investment. For the second quarter of 2026 the EU fertiliser and plant protection indices are Eurostat estimates, Germany's output index is provisional from the fourth quarter of 2025, and the Italian and Spanish output and input indices are provisional for the first two quarters of 2026, so they may be revised. All figures were recomputed independently from the original Eurostat files.
Sources
- Eurostat. (2026). Price indices of agricultural products, output, quarterly data (apri_pi_outq). Updated 10 September 2026.
- Eurostat. (2026). Price indices of the means of agricultural production, input, quarterly data (apri_pi_inq). Updated 10 September 2026.
- Eurostat. (2026). Price indices of agricultural products (apri_pi), metadata.