

In September 2026 natural gas in Europe cost 2.3 times as much as in September 2025, while in the five earlier cases since 1985 when its price rose 50% or more within three months, urea was dearer three months later only twice, according to a Wikifarmer analysis of World Bank monthly commodity prices. The question matters because natural gas is the main feedstock for nitrogen fertilisers, and because the gas price rose 67.6% from June to September 2026.
European natural gas costs 2.3 times as much as a year ago
The European natural gas price reached $25.42 per million British thermal units (MMBtu) in September 2026, up from $11.12 in September 2025, a rise of 128.6% and the highest level since December 2022, when it was $36.04 (World Bank). The rise ran through the summer, from $15.17 in June to $18.06 in July, $21.11 in August and $25.42 in September. The International Monetary Fund's own series for European gas shows the same picture, at $25.49 in September 2026 against $11.00 a year earlier, a rise of 131.7% (IMF, Primary Commodity Prices).
The two world urea prices are moving in opposite directions
The World Bank's f.o.b. Middle East urea price was $407.5 per tonne in September 2026, 11.6% below the $461.1 of September 2025 and 10.1% below June, after reaching $856.9 in April 2026, the highest since April 2022. The IMF's urea series instead shows a rise of 9.9% over the same period, from $236.86 to $260.27 per short ton, or about $286.9 per metric tonne. The gap is not a matter of units, since even after conversion the IMF price is about 30% below the World Bank's, so the two series most likely track different reference markets, and the IMF files do not say which market its series covers. Whether urea is dearer or cheaper than a year ago therefore depends on which series is read.
After five sharp gas rises urea was dearer only twice
Since 1985 the European gas price has risen 50% or more within three months in six episodes, in August 2020, June 2021, July 2022, October 2023, March 2026 and now September 2026, with none between 1985 and 2019. In the five completed episodes the urea price three months later was 1.8% lower, 6.5% higher, 5.9% higher, 18.5% lower and 37.6% lower, and six months later it was again higher in only two of the five, at +34.3%, +126.3%, −26.2%, −22.2% and −43.8%.
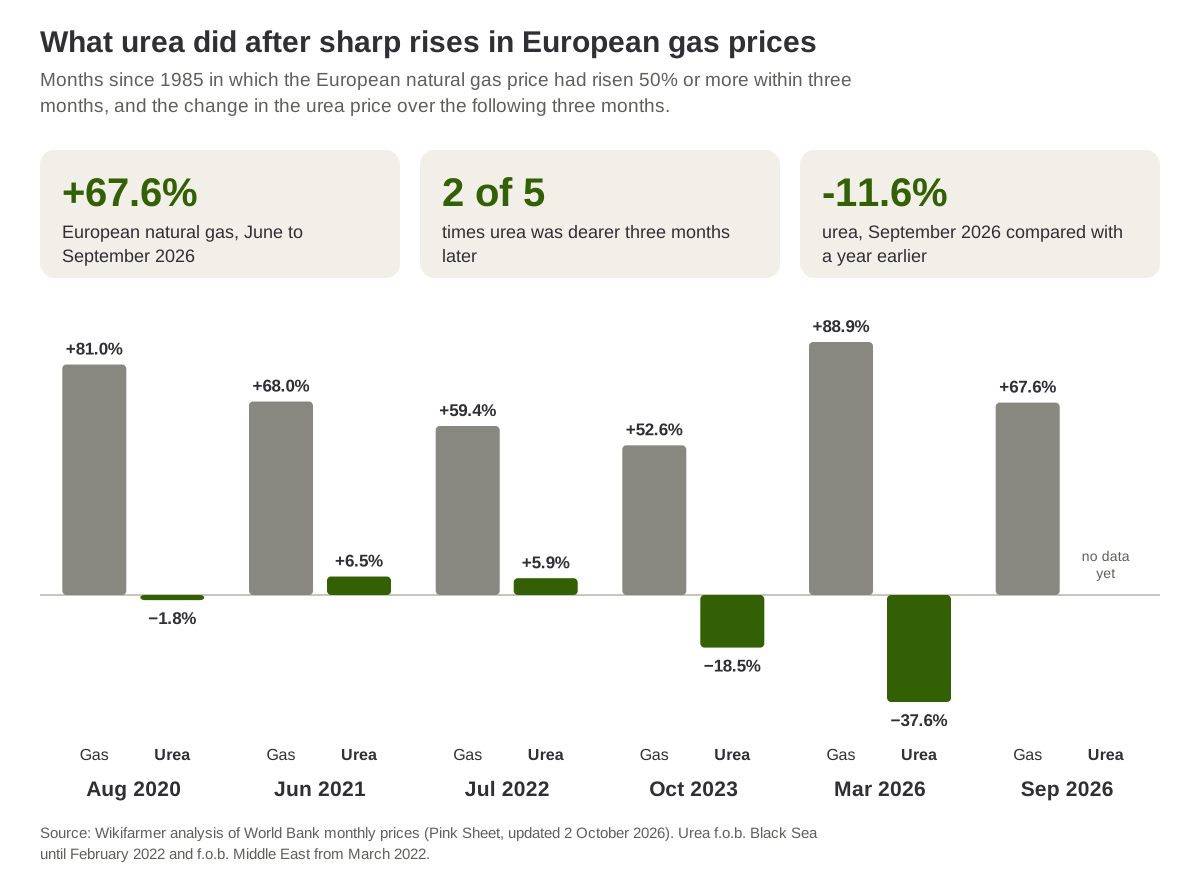
Source: Wikifarmer analysis of World Bank monthly prices (Pink Sheet, updated 2 October 2026).
In March 2026 urea had already risen 84.9% over the same three months as gas, a period in which the escalation in the Middle East since late February disrupted shipping through the Strait of Hormuz, and over the following three months it fell 37.6%. In September 2026, by contrast, gas rose 67.6% from June while Middle East urea fell 10.1%.
The link between gas and urea is weak and appears only after 2015
From April 2015, when the World Bank switched to the TTF price for Europe, to September 2026, the monthly change in the gas price correlates with the change in urea the following month with a coefficient of about 0.3, a weak relationship. Without the energy crisis months from July 2021 to December 2022 the coefficient falls to about 0.2, and from June 2000 to December 2020 it was close to zero, so the link appears only in recent years and is not enough to estimate the urea price from the gas price.
The urea price matters to anyone buying nitrogen for spring
In the northern hemisphere nitrogen top-dressing of winter cereals takes place mainly from late winter into spring, so the urea price over the coming months matters to farmers, cooperatives and fertiliser traders. The data do not show that a sharp rise in gas is as a rule followed by dearer urea, since in the five episodes urea was dearer three months later twice and six months later also twice. For anyone comparing the cost of nitrogen with the price they get for their crop, relative to wheat, urea is back to its usual level since 2000, while phosphate fertilisers remain expensive.
The analysis uses World Bank monthly prices (Pink Sheet, updated 2 October 2026) and, for the comparison of series, IMF monthly commodity prices (PCPS, released 6 October 2026), as monthly averages in current dollars, not the prices farmers pay in each country. The World Bank's European gas price is the TTF price from April 2015 and was based on border import prices before that, and urea is f.o.b. Black Sea until February 2022 and f.o.b. Middle East from March 2022, so the 2020 and 2021 episodes refer to Black Sea urea. An episode starts in the first month in which the gas price is 50% or more above its level three months earlier, and the urea change is measured from that same month. Five episodes are too few to support a rule. The data show what happened in past episodes and are not a forecast. The World Bank's October prices are expected in early November, and a completed three-month window after September will be available in January 2027. All numbers were recomputed independently from the original files.
Sources
- World Bank. (2026). Commodity Markets, Pink Sheet monthly historical prices (October 2026 release). World Bank Group.
- International Monetary Fund. (2026). Primary Commodity Price System (PCPS). IMF Data.