






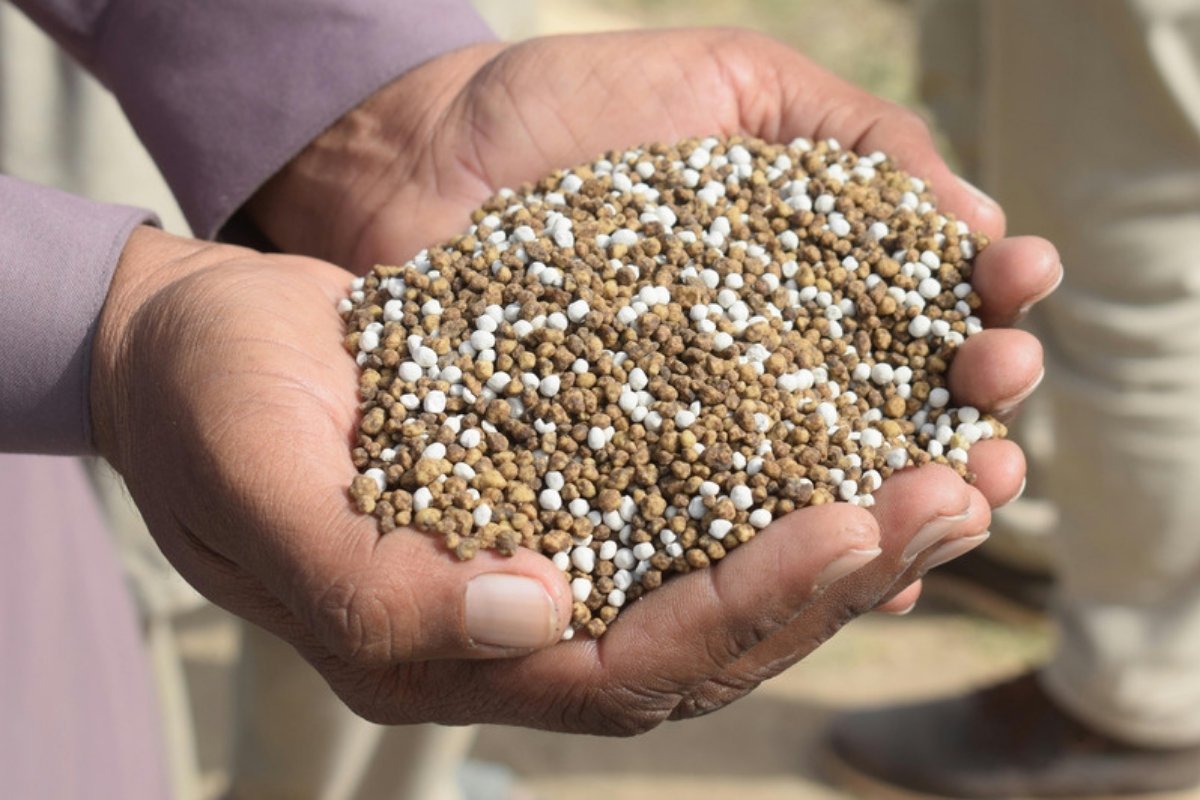
In September 2026 a tonne of diammonium phosphate (DAP) cost as much as 2.31 tonnes of wheat on world markets, a ratio exceeded in only 34 of the 717 months since 1967, according to a Wikifarmer analysis of World Bank monthly commodity prices. Urea, which in April reached its most expensive ratio to wheat since 1960, is back to the usual level of the months since 2000, after its price fell by more than half while wheat rose. The ratios matter now for the autumn sowing of winter cereals in the northern hemisphere, when phosphorus is usually applied as part of the basal dressing.
A tonne of DAP costs as much as 2.31 tonnes of wheat
DAP was priced at $800.6 per tonne free on board at US Gulf ports in September 2026, the highest since May 2022 and 44.3% above September 2024. Only March to October 2008 and March to May 2022 had prices at or above that level (World Bank). Over the same period US hard red winter (HRW) wheat rose to $347 per tonne, 48.4% more than a year earlier and the highest since May 2023. The rise came in the year of the smallest US winter wheat crop since 1965.
The rise in wheat cut the ratio from 3.34 tonnes in September 2025 to 2.31, the lowest since February 2025. It is still 45.3% above the median of the months since 2000, which is 1.59 tonnes, and 80.9% above the median of all months since 1967. The ratio was higher only in months of 1974, 1975, 2008, 2010 and 2015, and in every month from March 2025 to August 2026.
DAP was dearer in maize terms only in 2008 and in months of 2025 and 2026
With US maize at $239.6 per tonne, a tonne of DAP cost as much as 3.34 tonnes of maize in September, just over twice the median of all months since 1967, which is 1.65 tonnes. Only 20 months since 1967 had a higher ratio, 9 of them in 2008 and the other 11 in 2025 and 2026, and the highest, 4.97 tonnes, came in October 2008. In the current cycle the ratio peaked at 4.29 tonnes in August 2025, and the September reading is the lowest since March 2026.
Urea reached its most expensive ratio to wheat since 1960 in April
The urea price rose 81.5% in two months, from $472 per tonne in February to $856.9 in April 2026, a level exceeded only in November and December 2021 and in March and April 2022. According to the World Bank, the surge was driven by major export disruptions after the closure of the Strait of Hormuz, a key route for fertiliser exports from the Middle East, which accounts for nearly a quarter of global urea exports.
In April a tonne of urea cost as much as 3.04 tonnes of wheat and 4.00 tonnes of maize, the highest ratios since 1960. Before 2026 the highest were 2.52 tonnes of wheat in September 2008 and 3.62 tonnes of maize in November 2021, and all three spring months from March to May 2026 were above the 2008 peak for wheat. In the EU the spring rise in nitrogen prices was followed in May by the adoption of the EU's Fertiliser Action Plan.
Urea is back to its usual level since 2000
Between April and September the urea price fell 52.4% to $407.5 per tonne, 11.6% below a year earlier, while wheat rose 23.0% over the same months. A tonne of urea now costs as much as 1.17 tonnes of wheat, 1.9% below the median of the months since 2000. Against maize the ratio is 1.70 tonnes, 11.0% above the median for the same period.
TSP is also expensive relative to wheat
Triple superphosphate (TSP) cost as much as 1.99 tonnes of wheat in September, a ratio exceeded in only 41 of the 801 months since 1960, so the picture is not limited to DAP. Potassium chloride, by contrast, cost as much as 1.06 tonnes of wheat, slightly below its median since 2000. Back in May the World Bank noted that, despite the rise in its price, potash affordability relative to food prices had stayed close to pre-2020 levels.
| Price ratio | September 2026 | Median since 2000 | Months with an equal or lower ratio, whole series | Months with an equal or lower ratio, since 2000 | Highest monthly ratio |
| DAP to wheat | 2.31 | 1.59 | 95.3% | 90.7% | 3.83 in October 2008 |
| DAP to maize | 3.34 | 2.08 | 97.2% | 93.8% | 4.97 in October 2008 |
| TSP to wheat | 1.99 | 1.46 | 94.9% | 89.7% | 4.06 in October 2008 |
| Urea to wheat | 1.17 | 1.20 | 73.4% | 46.4% | 3.04 in April 2026 |
| Urea to maize | 1.70 | 1.53 | 83.0% | 63.6% | 4.00 in April 2026 |
| Potassium chloride to wheat | 1.06 | 1.13 | 75.9% | 40.5% | 2.95 in March 2009 |
Source: Wikifarmer analysis of World Bank monthly prices (Pink Sheet, updated 2 October 2026), in US dollars per tonne, to September 2026. The ratio is the number of tonnes of grain worth one tonne of fertiliser. Series start in January 1960, DAP in January 1967. The urea price refers to Middle East shipments from March 2022 and Black Sea shipments before that. The potassium chloride price refers to Brazil from January 2020 and Vancouver before that.
The ratio shows how many tonnes of grain buy a tonne of fertiliser
The ratio divides the fertiliser price by the grain price in the same month, so it is not affected by inflation or by exchange rates, since both prices are in dollars. These are international trade prices at major export ports, with US HRW, a bread wheat, as the wheat benchmark and US No. 2 yellow maize as the maize benchmark. Farmers in each country buy fertiliser at retail and sell grain at prices that also depend on freight, currency and grain quality, so the ratio shows the direction of the world market, while the cost on any one farm depends on the prices it actually pays.
DAP is priced free on board at US Gulf ports and TSP at import into the same Gulf, and three series changed their basis over time. Urea is priced free on board in the Middle East from March 2022 and in the Black Sea before that, and potassium chloride as granular product at cost and freight (CFR) Brazil from January 2020 and free on board Vancouver before that. The HRW wheat grade changed in July 2020. For urea, the March 2022 switch coincides with the general rise in fertiliser prices that month and shows no separate jump, and the April 2026 ratios exceed the peaks before 2026 by 11% to 21%. All figures were recalculated independently from the original World Bank file.

Relative to wheat, urea now sits close to its median since 2000, while DAP for the basal dressing costs about 45% more
Autumn sowing starts with expensive phosphorus and cheaper nitrogen
For winter cereals sown in the northern hemisphere this autumn, a tonne of DAP for the basal dressing costs about 45% more in wheat than the median of the months since 2000, so a recent soil test helps match the phosphorus rate to what the field actually needs. This follows a spring in which Strait of Hormuz disruption changed fertiliser planning. For the nitrogen top dressing later in the winter, the choice between urea 46-0-0 or ammonium nitrate is now made with a urea price that, relative to wheat, sits close to its median since 2000, even though the same ratio climbed to its highest since 1960 within two months last spring.
Sources
- World Bank. (2026). Commodity Markets, Pink Sheet monthly prices. World Bank Group.
- Baffes, J., & Temaj, K. (2026, May 14). Fertilizer prices surge as Strait of Hormuz disruptions tighten supplies. World Bank Data Blog.