")

Between 2020 and 2022, a Hungarian farmer's input bill jumped 80%. A Lithuanian farmer's more than doubled. In Greece, the hit was smaller - close to 37% - but when your margins are already thin, 37% is the difference between staying solvent and borrowing to plant.
Those costs came down after the initial shock, but they never returned to where they started. And now, with the war in Iran disrupting the Strait of Hormuz since late February 2026, they are climbing again.
Eurostat's agricultural input price index for the EU-27 peaked at 146.9 in 2022 and settled at 132.1 by the end of 2025 - still 32% above 2020 levels. That number barely moved between 2024 and 2025. Farmers had just started adjusting to the new cost floor when oil broke past $110 a barrel in March 2026, ammonia prices jumped $30 per tonne in a single week, and the International Energy Agency called it the worst global energy disruption in history.
Here's the thing. European farming runs on fossil fuels. Not just in the obvious way - the diesel in the tractor - but in ways most people outside the sector never think about.
Where the money goes on a European farm
A farm consumes energy in two places. The obvious one is diesel for tractors, harvesters, tillage equipment, irrigation pumps, and on-farm transport. In the EU, open-field agriculture, on-farm diesel accounts for 31% of total energy inputs. Oil and petroleum products account for 56% of the sector's direct energy consumption.
The less obvious one is fertilizer. Producing one tonne of ammonia, the base for most nitrogen fertilizers, requires between 28 and 37 GJ of natural gas, depending on plant efficiency, with a global average around 41 GJ (IEA, Ammonia Technology Roadmap). Fertilizer manufacturing alone consumes around 50% of all energy inputs in EU agriculture. Before the war in Ukraine, gas represented about 20% of fertilizer production costs in Europe. By 2025, that share had climbed to 30% (Argus Media, 2026) because the conflict rewired European gas supply routes and pushed structural costs higher.
So a farmer filling a tractor and a farmer buying a bag of urea are both, ultimately, paying an energy bill. The tractor is just the one they can see at the pump.
Before Russia invaded Ukraine, gas made up roughly 20% of European fertilizer production costs. An Argus Media analysis from January 2026 put that figure at 30%, because the war rerouted Europe's gas supply and pushed structural costs higher. A French wheat farmer in 2025 spent about 14% of their entire per-hectare budget on fertilizers alone.
Then February 28 happened. S&P Global reported ammonia FOB Middle East jumping to $505 per metric tonne by March 4, with three ammonia ships stranded in the Strait of Hormuz. Granular urea in Brazil hit $540-545/t CFR on March 3 - the highest level since S&P Global began that price series. In the US, granular urea reached $540-550 per short tonne, also a record for that assessment. And the benchmark LNG price for Northeast Asia, the JKM, doubled from $10.70 to $22.02 per MMBtu in a single week.
The FAO's chief economist Maximo Torero warned in mid-March that if the conflict lasts just a few more weeks, global food supplies will be significantly disrupted. "This will affect planting," he said. "There will be a lower supply of commodities in the world."
For European farmers, who were already dealing with a 32% cost increase from the 2022 shock, the timing could not be worse. Spring planting is underway. Fertilizer has been ordered. Diesel tanks need filling. There is no option to wait it out.
.png)
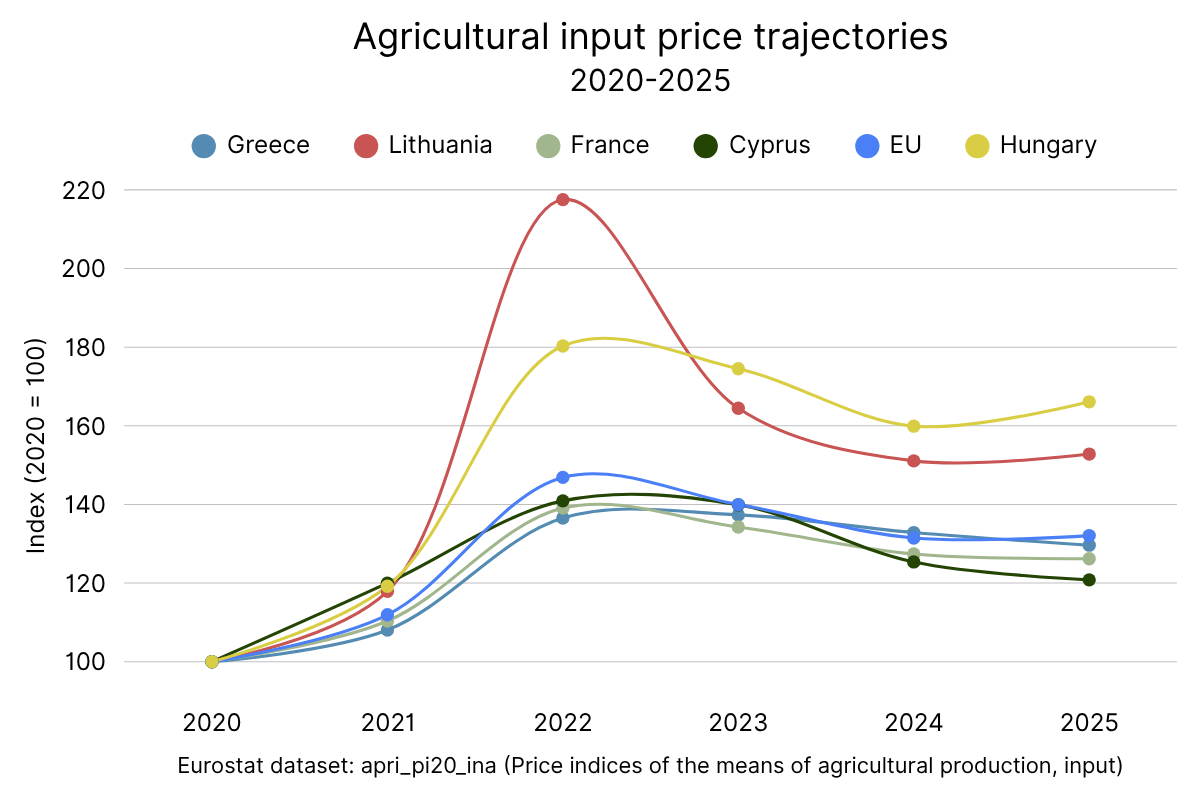
Not every country got hit the same way
The EU average masks enormous variation. Lithuania's input price index reached 217.5 in 2022 - the highest spike in the EU - and still sat at 152.8 in 2025, more than 50% above pre-crisis levels. Hungary peaked at 180.3 and remained at 166.1. Croatia spiked to 185.5 but recovered faster, landing at 141.1.
At the other end, Malta barely moved: 123.4 at peak, 123.7 in 2025. Cyprus reached 140.9 in 2022 but dropped below 121 by 2025 - the strongest recovery in the EU. Denmark, France, and Spain all came back below 128.
Greece sits at 129.6, below the EU-27 average, and has been declining since 2023. That is relatively good news compared to eastern and northern neighbours, but still means Greek farmers are paying nearly 30% more for the same basket of inputs they bought five years ago.
Countries that depended most heavily on Russian gas, had limited domestic fertilizer production, or ran input-intensive arable systems, were hit hardest and recovered slowest. Countries with more diversified energy supplies, warmer climates that require less heating infrastructure, or farming systems less dependent on synthetic nitrogen fared better.
The cost-price gap
Input costs are only half the equation. The other half is what farmers actually receive for their produce.
Eurostat published its Q4 2025 agricultural price data on March 12, 2026. Output prices - what farmers receive for their produce - fell 1.9% year-on-year. Cereal prices dropped 8.9%. Milk fell 4.1%. Over the same period, fertilizer and soil improver prices were still climbing, up 7.9%.
That is the core of the problem: Costs settle at a higher plateau while revenues decline. The inputs cost more than they did before the crisis, the output sells for less than it did during the crisis, and the margin between the two is where the farm either survives or doesn't.
The European Commission's short-term agricultural outlook from July 2025 acknowledged that EU farmers faced historically high input costs, though costs had stabilized. The same report warned that oil prices could rise again if Middle East tensions escalated. The EU's energy import bill, while down from a peak of €604 billion in 2022, still stood at €427 billion in 2024.
Why some farms feel this less
Let's be honest, no farm is immune to oil at $110. But some farms feel it less, and the reason is structural.
A farm that plows 25 cm deep with a heavy tractor burns roughly 24 litres of diesel per hectare. A farm using direct sowing on the same field uses about 6 litres, which is 3.8 times less (Bogunovic et al., 2022). Strip tillage falls in a similar range. At €1.50 per litre, that difference is worth about €27 per hectare per pass. Over a full season with multiple operations, the savings compound.
Conservation agriculture, reduced tillage, permanent soil cover, diversified rotations, and direct cuts in diesel consumption. The FAO defines soil tillage as "a very energy-consuming process that releases large amounts of CO₂ from fossil fuels and the oxidative breakdown of soil organic matter." Field trials across the EU show fuel savings of 35% to 88%, depending on the system adopted.
The fertilizer side of the equation works similarly. A farm that builds soil nitrogen through legume rotations, cover crops, and composting buys less synthetic nitrogen. Less synthetic nitrogen means less exposure to natural gas markets. The connection between a gas pipeline and a farm gate becomes weaker.
Organic farming systems, which prohibit synthetic nitrogen entirely, are structurally disconnected from that cost chain. They still burn diesel and still face transport costs, but they skip the single largest indirect energy input in conventional arable production. Regenerative agriculture operates on a similar logic: reduce purchased inputs, build biological fertility, and let the farm's own nutrient cycling do more of the work.
This is not a silver bullet. Organic and regenerative systems carry their own costs - higher labour requirements, lower yields per hectare in some crops, and certification overheads. But their cost structure tracks energy markets less closely, which means less volatility from one season to the next. When gas prices doubled in 2022, a farm buying 200 kg of synthetic nitrogen per hectare felt it immediately. A farm that had already replaced half of that with legume-fixed nitrogen felt half the impact.
Transport and the food chain
Energy costs also move through the food supply chain after the farm gate. Diesel powers the trucks, refrigeration units, and distribution networks that move produce from the field to consumers. When fuel prices rise, haulage rates follow.
Eurostat's Key Figures on the European Food Chain report (2025) links rising energy and transport costs directly to food price inflation, which stood at 3.4% in the EU in August 2025, up from 1.7% a year earlier.
Shorter supply chains and direct-to-consumer models reduce exposure by cutting out transport links and intermediaries. Grouped delivery days, consolidated loads, and regional distribution help absorb cost increases. But as long as European food logistics run on diesel, and they overwhelmingly do, fuel prices will show up in the price of food.
What this means in practice
Every litre of diesel a farm avoids burning, and every kilogram of synthetic nitrogen it replaces with biological fertility is one fewer variable tied to global energy markets. The farms that reduced their input dependency before 2022 absorbed the shock better than those that did not. And as a result, nations with less energy-intensive farming systems recovered faster.
For individual farms, the practical responses are well documented. Reducing tillage intensity where soil and crop conditions allow. Introducing legumes and cover crops into rotations. Composting on-farm. Improving machinery efficiency. Locking in fuel and fertilizer prices early when possible - like the Minnesota farmer interviewed by Brownfield Ag News, who bought his anhydrous ammonia the day after the war started at $905 per tonne, before it climbed past $950.
The European Commission's EU Agricultural Outlook 2025-2035 projected that crude oil would stabilize around $102 per barrel by 2035. That projection is already outdated. But its underlying message still holds. Energy will remain expensive for the foreseeable future. The question for each farm is how much of that expense ends up in the budget and how much has been designed out before the next crisis arrives.
Because there will be a next one.
References
- Bogunovic, I., et al. (2022). Reducing carbon footprint of agriculture - Can organic farming help to mitigate climate change?. Agriculture, 12(9), 1383.
- European Commission. (2025). Energy prices and costs in Europe - 6th report.
- IEA. (2021). Ammonia Technology Roadmap - Towards more sustainable nitrogen fertiliser production. International Energy Agency.
- European Commission. (2025). Short-term outlook for EU agricultural markets.
- European Commission. (2025). EU Agricultural Outlook 2025-35.
- Eurostat. (2025). Price indices of the means of agricultural production - input (2020=100). Dataset apri_pi20_ina, last updated 22/12/2025.
- Eurostat. (2025). Key figures on the European food chain - 2025 edition.
- Eurostat. (2025). EU agricultural output prices up 5.6% - Q2 2025.
- Eurostat. (2026). Agricultural prices down in Q4 2025.
- Eurostat. (2026). Producer prices for energy decline gradually in 2025.
- Eurostat. (n.d.). Agri-environmental indicator - energy use.
- Tzemi, D. & Muñoz, R. P. (2022). Energy use in open-field agriculture in the EU: A critical review recommending energy efficiency measures and renewable energy sources adoption. Renewable and Sustainable Energy Reviews, 158, 112098.


")


