


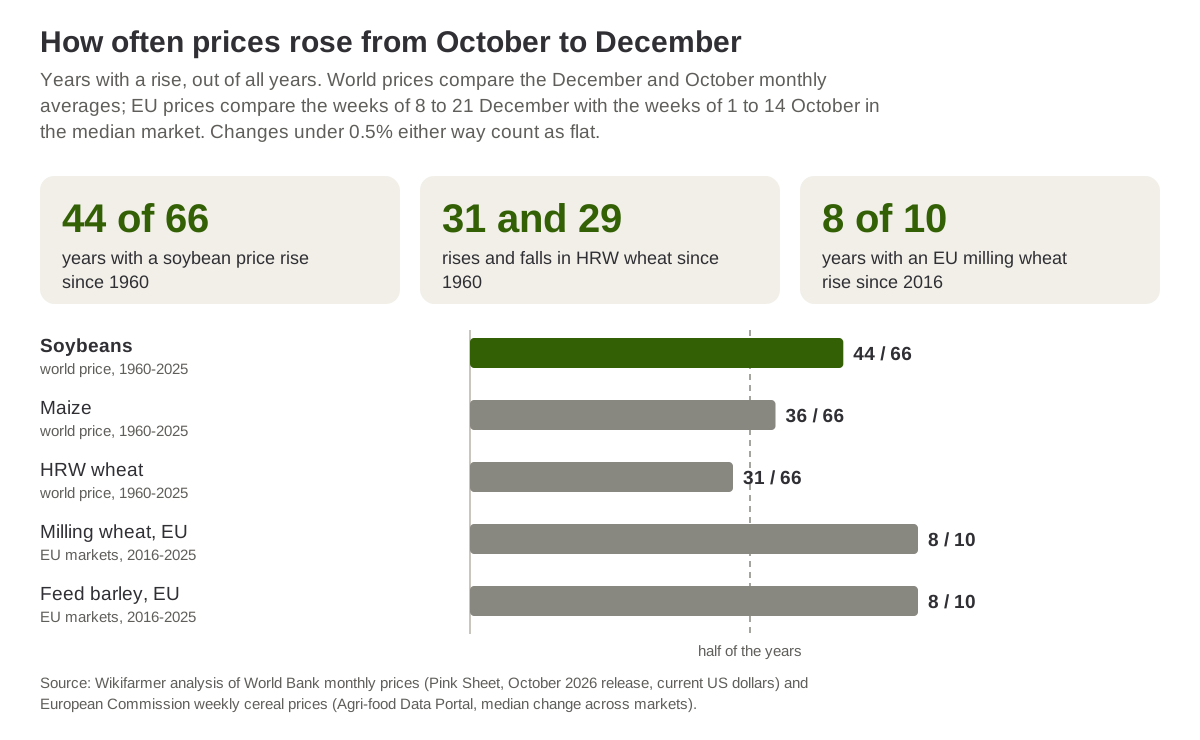
The world soybean price was higher in December than in October in 44 of the 66 years from 1960 to 2025, while the wheat price rose in 31 years and fell in 29, according to a Wikifarmer analysis of World Bank monthly commodity prices. In EU markets, the milling wheat prices that member states report to the European Commission rose from early October to mid-December in 8 of the 10 years since 2016, a record too short to rely on. The question matters now, because the northern hemisphere wheat harvest is over, the maize and soybean harvests are under way, and farmers and traders are deciding whether to sell or to store.
Wheat prices rose and fell about equally often since 1960
The World Bank publishes a monthly average export price for US hard red winter (HRW) wheat at the Gulf of Mexico ports, in US dollars per tonne and not adjusted for inflation. HRW is a bread wheat, distinct from the durum wheat used for pasta (World Bank Pink Sheet). For every year from 1960 to 2025 we compared the December average with the October average and counted any change smaller than 0.5% either way as flat. Over 66 years the price rose 31 times, fell 29 times and was flat 6 times, with a median change of 0.0%. In the ten years from 2016 to 2025 falls outnumbered rises, 6 to 4.
The largest rises came in 1972 (17.6%), 1993 (16.7%) and 2010 (13.4%), and the largest falls in 2002 (14.6%), 1975 (11.8%) and 2022 (also 11.8%). Up to 1989, rises outnumbered falls 16 to 10. From 1990 to 2025 it was the other way round, with 15 rises and 19 falls. Leaving out 1972 and 1973, the years of the world food price crisis, gives 29 rises and 29 falls in 64 years.
Soybeans rose in two years out of three
The soybean price was higher in December in 44 of the 66 years, lower in 18 and flat in 4, with a median rise of 3.2% from October to December. Rises outnumber falls in every sub-period, with 20 of 30 years from 1960 to 1989, 15 of 20 from 1990 to 2009 and 9 of 16 from 2010 to 2025. Without 1972 and 1973, soybeans rose in 42 of 64 years. The soybean series changed specification in December 2007, so the 2007 rise compares two specifications; without that year, soybeans rose in 43 of 65 years.
The largest rise was 27.9% in 1972, followed by 1977 (15.3%) and 2020 (12.6%). In some years, however, soybeans fell by more than 10% over the same two months: by 14.0% in 1974, 12.3% in 1975 and just over 10% in 2008.
Source: Wikifarmer analysis of World Bank monthly prices (Pink Sheet, October 2026 release) and European Commission weekly cereal prices (Agri-food Data Portal).
Maize rose in 36 years and fell in 23
The export price of US yellow maize at the Gulf ports was higher in December in 36 years, lower in 23 and flat in 7. Rises clearly outnumbered falls up to 2009, but since 2010 the two directions are close to even, with 7 rises, 6 falls and 3 flat years. The three largest October-to-December falls since 1960 came in 2008 (13.5%), 2022 (12.0%) and 2023 (10.5%).
EU milling wheat rose in 8 of the last 10 years
The European Commission publishes weekly cereal prices that member states report for their main markets, in euros per tonne (Agri-food Data Portal). For each market and price stage we averaged the weeks beginning 1 to 14 October and the weeks beginning 8 to 21 December, then took the median change across all markets in each year. The weekly cereal prices in the database start in November 2015, so the comparison covers 2016 to 2025.
Milling wheat was dearer in mid-December in 8 of the 10 years, with the largest rise in 2021 (14.4%). It was cheaper in 2022, by 8.9%, and in 2023, by 0.5%, just outside the flat band. Most rises were small, and in 6 of the 8 rising years the change stayed below 6%, such as the 0.7% of 2025. Feed barley also rose in 8 of the 10 years, while feed maize rose in 6, fell in 2 and was flat in 2, with two of its rises only 0.55%.
With only ten years, if prices had no seasonal direction at all, 8 or more rises in 10 would turn up by chance about 5% of the time. We tested eight price series in total, so a result like this in one of them could be luck. The EU prices are also local prices in euros across dozens of markets, while the World Bank price is a single export price in dollars, so the two can move differently. Over the same ten years from 2016, the world wheat price rose only 4 times.
September 2026 prices were far above a year earlier
In September 2026 US HRW wheat cost $347 per tonne, 48.4% more than in September 2025. Maize was at $239.6, 21.4% above a year earlier, and soybeans at $524, 29.7% above (World Bank). From October to December 2025 all three rose, wheat by 5.2%, maize by 3.8% and soybeans by 8.9%.
In its September estimates the USDA raised world wheat supplies and cut world wheat trade, while around the Black Sea Russian wheat exports head for their lowest level in five years.
What the record means for sellers and buyers
Anyone storing wheat in the hope of a higher winter price finds no regular October-to-December rise in the world price, and storage costs money in space, insurance and interest. EU market prices rose more often in the last decade, but usually by little, and that gain has to be set against each farm's own storage costs. Autumn sowing happens at the same time, with phosphate fertiliser expensive relative to wheat, as the DAP to wheat price ratio shows.
For soybean buyers such as feed manufacturers, December was usually dearer than October, by a median of 3.2%, but in 18 of 66 years it was cheaper. These shares describe what happened in past years and do not forecast this year's move. We used the same approach for vegetable oil prices after strong El Niño events. In Wikifarmer's assessment, which does not come from the price test itself, the size of the South American soybean crop being planted now, the pace of Black Sea wheat exports and the dollar exchange rate are among the things that could change the picture this year.
The test counts directions in nominal monthly prices
The international prices are World Bank monthly averages in current US dollars. Each change is a simple percentage change from the October average to the December average of the same year, with changes under 0.5% either way counted as flat. The wheat series is HRW No. 1 up to June 2020 and HRW No. 2 from July 2020; maize is US No. 2 yellow at the Gulf ports; soybeans are US origin, specified as US No. 2 yellow CIF Rotterdam from December 2007 to December 2024 and priced FOB US Gulf from January 2025. Only the soybean change in December 2007 falls between October and December, which is why the result without 2007 is also given. For the EU, zero or missing prices were removed, and the number of milling wheat markets compared ranges from 45 to 72 a year (46 to 73 when price stages are counted separately). With other week windows, such as 1 to 14 December, or 1 to 7 October against 15 to 21 December, milling wheat shows 7 or 8 rises in the 10 years. The eight series tested were five world prices (HRW wheat, SRW wheat, maize, soybeans and Thai 5% rice) and three EU prices (milling wheat, feed barley and feed maize). All numbers were recomputed independently from the source files. The results describe past frequencies and are not a price forecast or advice to buy, sell or store.
Sources
- World Bank. (2026). Commodity markets, Pink Sheet monthly historical prices (October 2026 release). World Bank.
- European Commission. (2026). Agri-food Data Portal, API guide and weekly cereal prices. Directorate-General for Agriculture and Rural Development.