
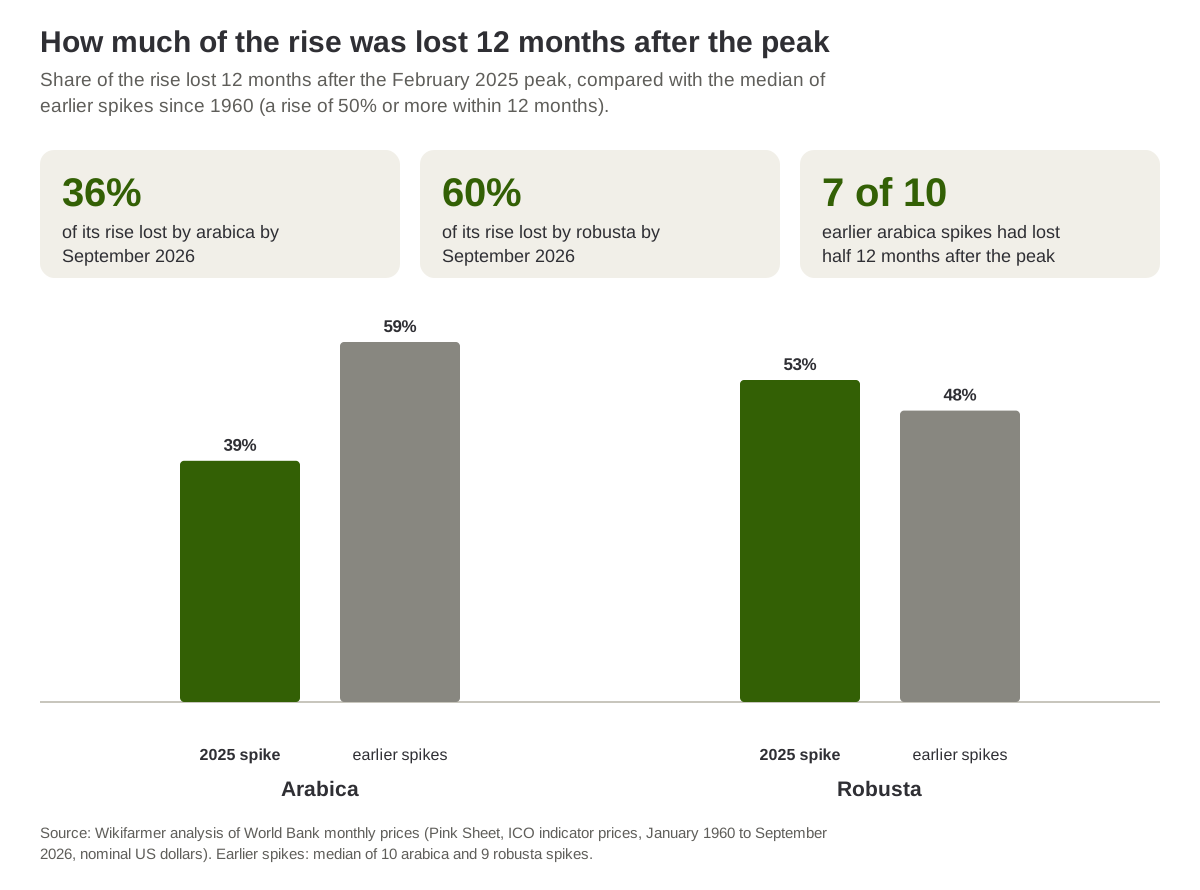
By September 2026 the price of robusta coffee had lost 60.2% of the rise it recorded from February 2023 to its peak in February 2025, while the arabica price had lost only 35.8% of its own rise, according to a Wikifarmer analysis of World Bank monthly commodity prices. In the 10 earlier arabica spikes since 1960, 12 months after the peak the price had lost at least half of its rise in 7, while arabica had then lost only 39.4%, so its price remains at a higher level than is usual after a spike, while robusta is close to its historical pattern.
The arabica price rose 123.5% and robusta 153.7% to February 2025
The arabica price, as published by the World Bank on the basis of the International Coffee Organization (ICO) indicator price, rose from 4.05 dollars per kilogram in September 2023 to 9.05 dollars per kilogram in February 2025, a rise of 123.5%, and reached 9.05 dollars again in November 2025 (World Bank). Robusta rose from 2.29 dollars in February 2023 to 5.81 dollars in February 2025, a rise of 153.7%. For the record prices of 2024 and 2025, an FAO study attributes the rise mainly to market fundamentals, meaning supply and demand.
The robusta price lost half of its rise within five months
In July 2025, five months after the peak, the robusta price had fallen to 3.69 dollars per kilogram and had lost 60.2% of its rise. In February 2026, one year after the peak, it was 3.96 dollars, having lost 52.6% of the rise, and in September 2026 it was again at 3.69 dollars per kilogram, 36.5% below the peak but 61.1% above February 2023. In September alone the price fell 7.3% compared with August.
The arabica price had lost 39.4% of its rise one year after the peak
In August 2025, six months after the peak, the arabica price was 8.08 dollars, having lost only 19.4% of the rise, and it then climbed back to 9.05 dollars in November. In February 2026 it was 7.08 dollars, so one year after the first peak 39.4% of the rise had been lost, while in September 2026 the price was 7.26 dollars per kilogram, 8.9% below August, 19.8% below the peak and 79.3% above September 2023. Because robusta fell further, arabica costs almost twice as much as robusta again.
Source: Wikifarmer analysis of World Bank monthly prices (Pink Sheet, update of 2 October 2026).
In earlier spikes the arabica price had usually lost half of its rise 12 months after the peak
For the 10 earlier arabica spikes since 1960 there are data for at least 24 months after the peak. Twelve months after the peak the price had lost at least half of its rise in 7, with a median loss of 58.8% of the rise after 12 months and 63.6% after 24 months, while the 39.4% of the latest spike is the third smallest of the 11, after the 28.8% of the spike that peaked in March 2005 and the 34.9% of the one that peaked in February 2022. After the 1986 peaks the price fell within a year even below the point where the rise had started, for both arabica and robusta.
| Peak | Low before the peak | Price at the peak (US dollars per kg) | Rise | Share of the rise lost after 12 months | Share of the rise lost after 24 months | Months until half was lost |
| May 1970 | July 1969 | 1.22 | 56.4% | 45.5% | 40.9% | 7 |
| April 1977 | April 1975 | 7.00 | 566.7% | 51.4% | 66.2% | 6 |
| October 1979 | February 1979 | 4.62 | 70.5% | 93.2% | 83.8% | 9 |
| March 1986 | August 1985 | 5.28 | 79.6% | 127.8% | 97.0% | 3 |
| September 1994 | September 1992 | 4.89 | 317.9% | 51.9% | 61.0% | 12 |
| May 1997 | December 1995 | 5.89 | 151.7% | 80.3% | 96.9% | 5 |
| March 2005 | June 2003 | 2.98 | 120.7% | 28.8% | 24.5% | never to date |
| April 2011 | April 2009 | 6.62 | 122.9% | 65.8% | 91.0% | 11 |
| October 2014 | November 2013 | 4.97 | 84.8% | 69.7% | 44.7% | 5 |
| February 2022 | February 2020 | 6.17 | 106.4% | 34.9% | 49.4% | 11 |
| February 2025 | September 2023 | 9.05 | 123.5% | 39.4% | not yet complete | not yet |
In the 9 earlier robusta spikes with complete data, the price had lost at least half of its rise 12 months after the peak in 4, with a median loss of 47.6% after 12 months and 64.3% after 24 months, so the 52.6% of the latest spike is slightly above the median. The spikes of 1977 and 1994, larger in percentage terms than the latest one for both types, lost 63.3% and 47.6% of the rise after 12 months for robusta and 51.4% and 51.9% for arabica.
| Peak | Low before the peak | Price at the peak (US dollars per kg) | Rise | Share of the rise lost after 12 months | Share of the rise lost after 24 months | Months until half was lost |
| May 1966 | May 1965 | 0.77 | 57.1% | 0.0% | 3.6% | 419 |
| April 1977 | May 1975 | 6.88 | 555.2% | 63.3% | 64.3% | 6 |
| July 1979 | July 1978 | 4.32 | 54.8% | 68.0% | 155.6% | 7 |
| September 1986 | September 1985 | 3.61 | 57.6% | 107.6% | 123.5% | 3 |
| September 1994 | September 1992 | 4.03 | 347.8% | 47.6% | 76.4% | 14 |
| January 2003 | January 2002 | 0.91 | 82.0% | 7.3% | 24.4% | 21 |
| March 2008 | March 2006 | 2.69 | 105.3% | 73.2% | 87.7% | 7 |
| May 2011 | March 2010 | 2.69 | 81.8% | 27.3% | 41.3% | 25 |
| December 2021 | April 2020 | 2.48 | 75.9% | 40.2% | -47.7% | never to date |
| February 2025 | February 2023 | 5.81 | 153.7% | 52.6% | not yet complete | 5 |
Source: Wikifarmer analysis of World Bank monthly coffee prices (Pink Sheet, update of 2 October 2026), in US dollars per kilogram, not adjusted for inflation. The first table covers arabica and the second robusta. The share of the rise lost is the part of the rise from the low to the peak that had been lost 12 or 24 months after the peak. A value above 100% means the price fell below the low where the rise started, and a negative value means the price was above the peak.
A spike is any rise of 50% within 12 months
The World Bank series are the ICO indicator prices, for arabica the average of the New York and Bremen or Hamburg markets for "other mild arabicas" and for robusta the average of the New York and Le Havre or Marseille markets, ex-dock, as monthly prices. A spike is any period in which the price rose at least 50% compared with the same month a year earlier, and such months are grouped into one spike when they are no more than 12 months apart. The peak is the most expensive month of the spike and of the 12 months that follow, and when two months have the same price the first counts, as with February 2025 for arabica. The starting point is the cheapest month in the 24 months before the peak, the same method used for cocoa.
The picture does not change materially with another threshold. With a 40% threshold there are 12 earlier arabica spikes with complete data, of which 9 had lost half of the rise 12 months after the peak, and 11 robusta spikes, of which 5, while with a 75% threshold there are 5 arabica spikes, all of which had lost at least half, and 4 robusta spikes, of which one.
The analysis uses the World Bank Pink Sheet (update of 2 October 2026, data from January 1960 to September 2026), in US dollars per kilogram, not adjusted for inflation. The comparisons cover up to four years, from the low to 24 months after the peak, so in periods of high inflation such as the 1970s the nominal percentages show a smaller loss than the real one. The loss shares measure where the price stood 12 and 24 months after the peak, not the lowest price within that period, and the 2025 spike does not yet have 24 months of data after the peak, so it is not included in the figures for earlier spikes. All figures were recomputed independently from the original file.
The fall matters to coffee growers and roasters
The fall from the peak concerns arabica growers in Latin America and East Africa, robusta growers in Asia and Africa, and the roasting companies that buy green coffee. The prices growers receive in each country differ from the indicator prices, depending on quality, currency, transport costs and the way the market is organised in each country, since according to the FAO study a price rise on the world market reaches growers and shelves only in part. In October arabica futures in New York lost 1.2%, according to Reuters, which links the fall to improved supplies.
The history of spikes shows that the arabica price has so far lost a smaller part of its rise than in most earlier spikes, while robusta is close to the usual path. The samples are small, 10 and 9 spikes, and the figures describe what the price did in the past. In the coming months, the World Bank's monthly price for October, expected in early November, and exports from the main producing countries are worth following. The figures describe what the price did and are not a forecast.
Sources
- World Bank. (2026). Commodity Markets, Pink Sheet monthly prices. World Bank Group.
- Reuters. (2026, 1 November). Raw sugar gains. Business Recorder.