

Twelve months after its January 2025 peak, the price of cocoa had given back 71.1% of the rise it recorded from January 2023, while in the seven earlier spikes since 1960 that share never went above 51.1%, according to a Wikifarmer analysis of World Bank monthly commodity prices. By March 2026 the loss had reached 92.4% of the rise, but the price has since climbed 82.7%, so the market enters the 2026/27 crop with a price that has changed direction twice in less than two years.
Cocoa rose 310% from January 2023 to January 2025
The monthly average cocoa price was $2.62 per kilogram, or $2,620 per tonne, in January 2023 and reached $10.75 per kilogram in January 2025, a rise of 310.3% in two years (World Bank). Before 2024 the highest monthly price in the series, which starts in January 1960, was $4.36 per kilogram in July 1977. The rise from 2023 to 2025 was the largest of the eight spikes in the period, ahead of the one from July 1975 to July 1977, which reached 248.8%. It followed the harvest collapse in Côte d'Ivoire and Ghana, the two largest producing countries.
The price lost 92% of the rise in 14 months
In July 2025, six months after the peak, the price had fallen to $7.37 per kilogram and had given back 41.6% of the rise. In October, nine months after the peak, the loss passed half for the first time. By January 2026 the price was $4.97, so 71.1% of the rise had gone in one year, and the low came in March 2026 at $3.24 per kilogram, a loss of 92.4% of the rise within 14 months. Even at that low the price was still 23.7% above January 2023.
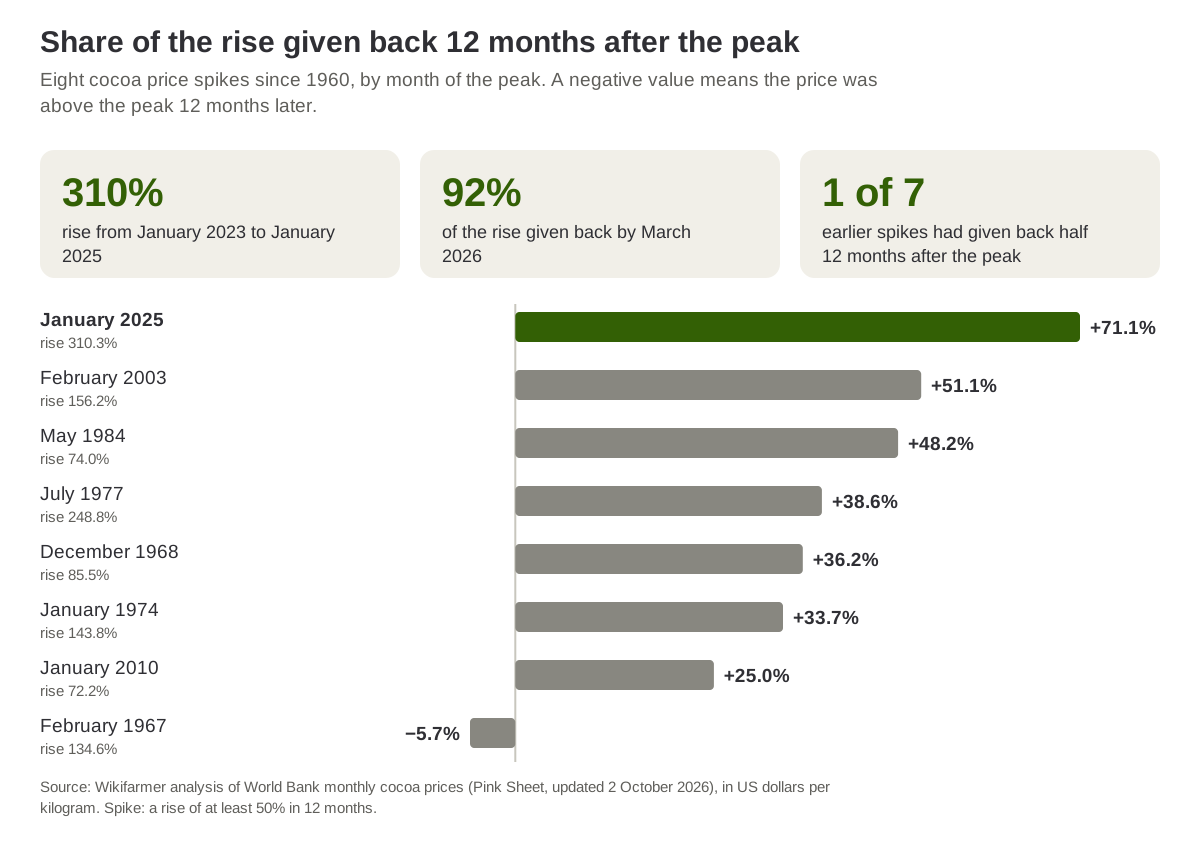
Source: Wikifarmer analysis of World Bank monthly prices (Pink Sheet, updated 2 October 2026). A negative value means the price was above the peak 12 months later.
In earlier spikes the price kept most of its rise a year after the peak
All seven earlier spikes have at least 24 months of data after the peak. Twelve months after the peak, the price had given back at least half of the rise in only one of them, the spike that peaked in February 2003, and 24 months after the peak in three, after the peaks of 1968, 1984 and 2010. The median loss was 36.2% of the rise at 12 months and 46.8% at 24 months, and 24 months after the peak the price was closer to the peak than to its starting point in four of the seven.
The 1977 spike, the only one close in size to the latest, gave back 38.6% of its rise in 12 months and took 34 months to lose half. After the January 1974 peak the price took 189 months, almost 16 years, to give back half of the rise. After the February 1967 peak the price was above the peak 12 months later and never gave back half of the rise. The 2003 spike lost half of its rise within four months, faster than the latest one, but the price then recovered and 24 months after the peak the loss was 46.8%.
| Peak | Low before the peak | Price at the peak ($/kg) | Rise | Share of rise given back at 12 months | Share of rise given back at 24 months | Months until half was given back |
| February 1967 | July 1965 | 0.61 | 134.6% | -5.7% | -85.7% | never |
| December 1968 | December 1966 | 1.02 | 85.5% | 36.2% | 72.3% | 13 |
| January 1974 | January 1972 | 1.56 | 143.8% | 33.7% | 17.4% | 189 |
| July 1977 | July 1975 | 4.36 | 248.8% | 38.6% | 35.7% | 34 |
| May 1984 | November 1982 | 2.68 | 74.0% | 48.2% | 67.5% | 13 |
| February 2003 | February 2001 | 2.28 | 156.2% | 51.1% | 46.8% | 4 |
| January 2010 | November 2008 | 3.53 | 72.2% | 25.0% | 82.4% | 21 |
| January 2025 | January 2023 | 10.75 | 310.3% | 71.1% | not yet available | 9 |
Source: Wikifarmer analysis of World Bank monthly cocoa prices (Pink Sheet, updated 2 October 2026), in US dollars per kilogram, not adjusted for inflation. The share given back is the part of the rise from the low to the peak that had been lost 12 or 24 months after the peak. A negative value means the price was above the peak.
The price has risen 82.7% again since March 2026
From the March low the price rose to $5.92 per kilogram in September 2026, a rise of 82.7% in six months. It is now 44.9% below the peak and 15.8% below September 2025, but 126.0% above January 2023. The new rise came while the market weighed a large supply surplus against the El Niño risk to the 2026/27 crop, although this price analysis does not test what caused it.
A spike is any rise of 50% within 12 months
The World Bank series is the International Cocoa Organization (ICCO) price, the average of the three nearest futures contracts on the New York and London exchanges, taken as a monthly average. A spike is any period in which the price was at least 50% higher than in the same month a year earlier, and such months are grouped into one spike when they are no more than 12 months apart. The peak is the most expensive month of the spike and the 12 months that follow it, and the starting point is the cheapest month of the 24 months before the peak. The shares given back measure where the price stood 12 and 24 months after the peak, not the lowest price within that time.
A different threshold does not change the result. A 40% threshold gives ten complete spikes before the latest, of which only one had given back at least half of the rise 12 months after the peak and three 24 months after it, and a 75% threshold gives four, with one and none respectively. Because the comparisons cover 24 months at most, inflation has little effect on the results. Monthly averages smooth out daily swings, and the World Bank may revise the September 2026 price.
Growers and processors saw the price change direction twice in 20 months
From the January 2025 peak to September 2026 the price fell below a third of the peak and then rose 82.7% again. Swings of that size reach cocoa growers in West Africa, Latin America and Asia, traders, and chocolate makers that buy on forward contracts. The world price is only the first step, since according to an FAO study a world price increase never reaches the farm or the shelf in full, and the prices growers receive in each country follow with a delay and to a smaller degree.
The history of the series offers a limited basis for comparison, because the rise from 2023 to 2025 was larger than any earlier spike and the loss within the first year after the peak was also larger, so the latest spike lies outside the range recorded since 1960. In the coming months, the arrivals of the new crop at the ports of Côte d'Ivoire and Ghana, which start in October, the course of El Niño and the quarterly grinding data for Europe and North America are worth following. The figures describe what the price did and are not a forecast.
Sources
- World Bank. (2026). Commodity Markets, Pink Sheet monthly prices. World Bank Group.