")

How many different crops does a typical European region actually grow? About five. That number comes from the first satellite crop map to cover all 27 EU member states, published by the European Commission in January 2026.
The data behind it is impressive. Using images from the Copernicus Sentinel satellites at 10-metre resolution, researchers tracked crop patterns across more than 1,100 regions and 87,000 municipalities between 2017 and 2023. The picture is mixed. Some parts of Europe grow a wide variety of crops. Others are stuck growing just one or two.
Here's what the data shows, and why it matters for the future of European farming.
How the map was built
The EU's Copernicus Earth observation programme already plays a major role in agriculture. Around EUR 43 billion per year in farm policy payments, roughly 78% of the total Common Agricultural Policy budget, relies on satellite monitoring. But those same satellites also reveal how Europe's farmland is actually structured.
The Copernicus Land Monitoring Service released a product called the High Resolution Crop Type dataset. It covers the entire EU-27, identifying everything from cereals, root crops, and legumes to vineyards, olive groves, and orchards. Grasslands were mapped separately and then combined with the crop data [1].
To measure diversity, researchers used a standard index that looks at two things: how many crop types grow in a given area, and how evenly those crops are spread. A region where five crops each take up a similar share of the land scores higher than one where a single crop covers most of it, even if both technically have five crop types present.
Five crops per region on average, but the range is enormous
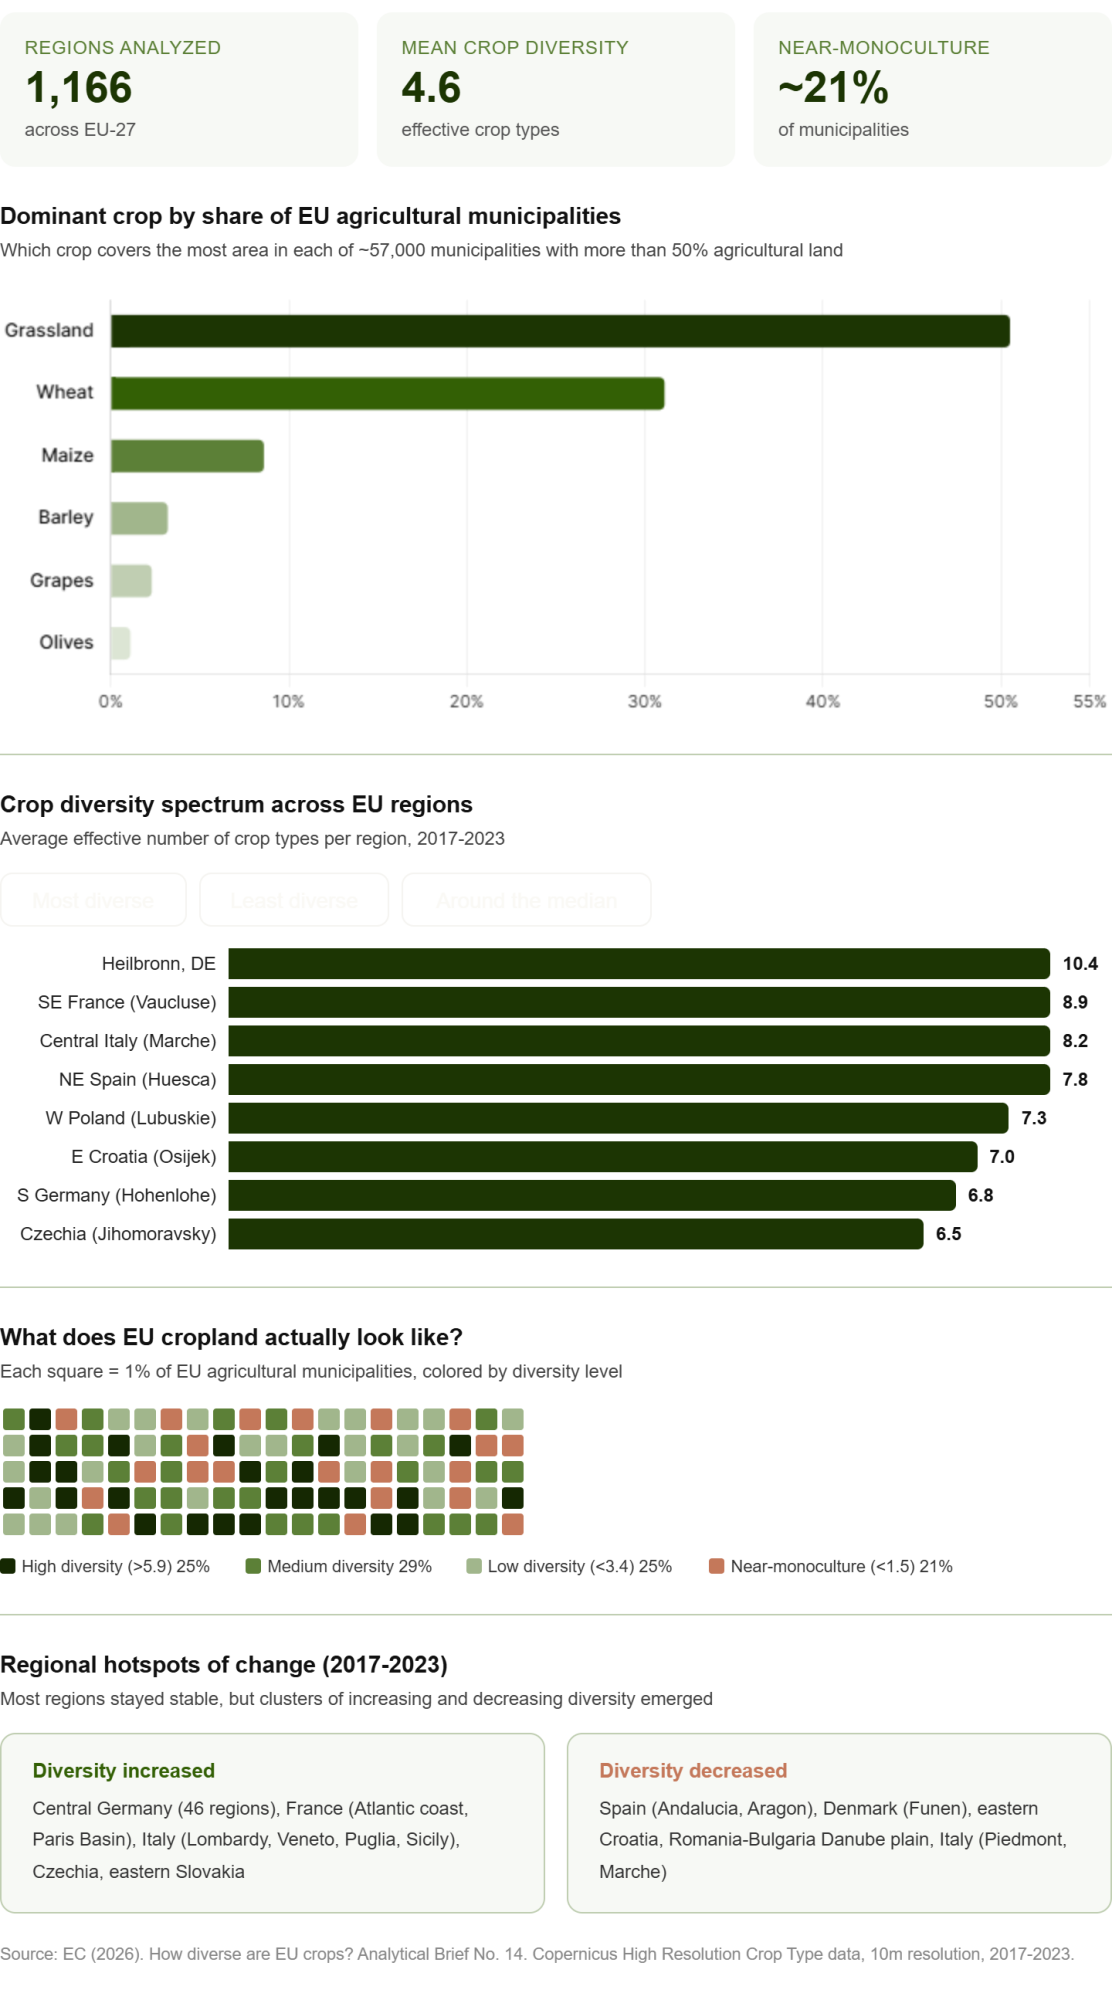
Across all 1,166 regions analyzed, the average diversity score came out to 4.6 crop types, with a median of 4.9. But the range between the most and least diverse regions is striking.
The most diverse areas appeared in south-east France, central Italy, north-east Spain, parts of southern Germany, western Poland, and eastern Croatia. These tend to be regions with a mix of arable farming, permanent crops, and varied terrain.
At the other end, lower diversity showed up in southern Greece (dominated by olives), north-west Spain, south-west France, and parts of northern Italy, places where a single crop or land use has long been dominant [1].
The single most diverse region in Europe was Stadtkreis Heilbronn in Germany, scoring 10.4. The least diverse was Ausserfern in Austria.
Grassland covers more EU farmland than any single crop
At the municipality level, grassland was the dominant land use in just over half of all agricultural municipalities across the EU. This reflects the importance of livestock farming, particularly in Ireland, parts of Portugal and the Netherlands, and mountain regions like the Alps and Massif Central [1].
After grassland, the dominant crops break down like this: wheat led in 31.1% of municipalities (northern France, the Danube basin, central Germany, the Italian Adriatic, parts of Lithuania), maize in 8.6% (the Po Valley, south-western France, parts of Central and Eastern Europe), barley in 3.2% (mainly Spain and Denmark), grapes in 2.3%, and olives in 1.1% (southern Spain, Greece, and Italy, especially Puglia and Sicily).
Some countries stood out for balanced farming. Denmark, Hungary, Slovenia, Poland, and Croatia all showed more varied crop rotation patterns, with relatively few municipalities dominated by a single crop.
One in five municipalities grows almost nothing but one crop
About 25% of EU municipalities had high crop diversity (more than 5.9 crop types), while another 25% had low diversity (fewer than 3.4 crop types). The most concerning number: roughly 21% of municipalities showed near-monoculture, with fewer than 1.5 effective crop types [1].
These near-monoculture areas cluster in Ireland, parts of Spain and Portugal, central France, the Netherlands, and northern Germany. But the context matters. In Ireland, low diversity mostly means grassland for dairy and beef cattle, which is a different situation from a 10,000-hectare wheat belt in the Paris Basin. Grassland-dominated livestock regions are not the same as intensive arable zones that grow a single grain year after year.
The areas that may need the most attention are the intensive arable monocultures in northern France, the Danube basin, parts of central Germany, the Po Valley, and south-western France. These are the regions where diversifying crops could bring the biggest gains in soil health, pest management, and climate resilience.
Where diversity is changing
Between 2017 and 2023, most regions stayed roughly stable. But some clear trends emerged.
Diversity increased in parts of France (along the Atlantic coast and around the Paris Basin), in central Germany (a cluster of 46 regions in Saxony-Anhalt, Lower Saxony, and Thuringia), in several Italian regions (Lombardy, Veneto, Puglia, Sicily), in Czechia, and in eastern Slovakia. The German case is interesting because those regions already grew many different crops. What changed was the balance between them. The share of the single most common crop dropped by about 2 percentage points on average, meaning farmers were spreading their land more evenly across different crops [1].
Diversity decreased in Andalucia and Aragon (Spain), Denmark (especially the island of Funen), eastern Croatia, the Romania-Bulgaria border area, and parts of Piedmont and Marche in Italy.
What satellite data can see that farm surveys cannot
The European Commission also compared this satellite data with the Farm Accountancy Data Network, which collects information from more than 75,000 individual farms across the EU.
The two datasets largely agreed. Both showed similar diversity patterns in dairy regions, grain-producing areas, and wine regions. Where they differed was in vineyards and horticultural areas. A vineyard farm might grow only grapes, which looks like low diversity in the farm survey. But the landscape around it often includes a mix of arable fields, orchards, and other crops, which the satellite picks up as moderate diversity [1].
This is the value of satellite monitoring. It captures the full picture of a landscape, something no farm-by-farm survey can do at this scale.
What this means for EU farm policy
Under the current EU farm policy (CAP 2023-2027), farmers must follow basic crop rotation or diversification rules, with exemptions for farms smaller than 10 hectares. After a simplification in 2024, member states were given more flexibility in how they apply these rules.
The Copernicus data could directly shape the next CAP period (2028-2034). The European Commission has noted that these satellite-based indicators could help identify areas with persistently low diversity and target support toward soil protection and crop diversification [1].
The practical message for farmers is straightforward. Satellite-verified crop diversity is moving from a research exercise to a policy monitoring tool. The data to track what is growing where, at landscape scale, already exists and is updated every year. Farmers who maintain diverse rotations and include legumes in their systems are positioning themselves ahead of where regulation is heading.
What farmers can take away from this
No single farmer controls the crop diversity of an entire municipality. That depends on climate, soils, markets, and local farming traditions. But the evidence is clear that farms with more varied crop rotations tend to have healthier soil, fewer pest problems, and better resilience when weather turns difficult.
Farmers in wheat-heavy or maize-heavy areas face the most practical pressure. If future EU support payments reward landscape-level diversity, expanding rotations to include legumes, oilseeds, or protein crops could become a financial advantage, not just a soil health benefit.
Farmers growing permanent crops like olives or grapes in southern Europe should understand that low rotation is simply part of how those crops work. The policy conversation around crop diversity is mainly aimed at arable systems, not orchards and vineyards.
The Copernicus dataset will be updated every year. For farmers, advisors, and policymakers, crop diversity across Europe is now a measurable, trackable number, and it is directly linked to how farm policy is being shaped.
References
- EC (2026). How diverse are EU crops? Analytical insights from the Copernicus high resolution crop type satellite data. Analytical Brief No. 14, January 2026. European Commission, DG Agriculture and Rural Development, Brussels.
")


