
When the Spanish price of extra virgin olive oil has moved by 3% or more in a week, the Greek price has moved the same way within three weeks in 76% of cases since 2005, according to a Wikifarmer analysis of the weekly prices that national ministries report to the European Commission. Spanish moves also help forecast Greek ones far more than the reverse. The finding matters this month, after the Spanish price fell 3.3% in the first week of October.
Spain's extra virgin price fell 3.3% in early October
The average Spanish price for extra virgin olive oil fell from €343.20 to €331.90 per 100 kg in the week starting 5 October 2026, a drop of 3.3% in one week. The Greek national average for the same week was €364.20 per 100 kg, up from €358.80 the week before (EU Agri-food Data Portal). Both are weekly national averages.
The Spanish fall came after Spain's first national estimate of 1.6 million tonnes for 2026/27, against a Greek 2026/27 crop of 280,000 to 300,000 tonnes. The question for Greek producers and buyers is whether a Spanish move of this size reaches Greek prices, and how fast.
The test uses 21 years of EU weekly prices
We took the weekly extra virgin national averages for Spain and Greece from the EU Agri-food Data Portal, from January 2005 to October 2026. That gives 1,038 weeks in which both countries reported a price and a change from the week before. We also compared individual markets: Jaén in Spain with Chania, Heraklion and Messinia in Greece.
All tests use weekly changes in the logarithm of the price, which are close to percentage changes, rather than price levels. The market series start in 2010. Prices in both countries trend together over years, so comparing levels would show a strong link even if neither market reacted to the other in the short run.
Greek prices moved the same way three times out of four
In 86 weeks between 2005 and 2026, the Spanish national price moved by 3% or more. In 76% of those weeks the Greek price moved in the same direction over the following three weeks. Including the same week, the share rises to 83%. When Greek prices did follow, the move was often as large as the Spanish one or larger, with a median of 1.2 times the Spanish move.
Rises carried across more often than falls. After a Spanish rise of 3% or more, Greek prices rose within three weeks in 81% of cases. After a Spanish fall of 3% or more, Greek prices fell in 70% of cases. In the weeks when they did fall, the median Greek fall was 5.2%, against a median Spanish fall of 3.8%.
| Spanish weekly move | Weeks | Greek price moved the same way within 3 weeks |
| 2% or more | 187 | 70% |
| 3% or more | 86 | 76% |
| 5% or more | 18 | 83% |
Source: Wikifarmer analysis of EU Agri-food Data Portal weekly extra virgin olive oil prices, national averages for Spain and Greece, January 2005 to October 2026.
Spanish moves predict Greek moves more strongly than the reverse
The correlation between Spanish and Greek weekly price changes is 0.34 in the same week. It falls to 0.25 when Greece is compared with the Spanish change one week earlier, 0.16 at two weeks and 0.13 at three weeks. The link fades after three weeks.
A Granger causality test asks whether past Spanish changes improve a forecast of Greek changes beyond what past Greek changes already give. They do, at every lag from one to four weeks, with p-values below 0.001. The reverse test, whether Greek moves help forecast Spanish ones, also finds a link at one and two weeks, but a much weaker one. The combined effect of past Greek moves on Spanish prices is less than a fifth of the effect in the other direction. The Spanish lead held in both halves of the period, 2005 to 2015 and 2016 to 2026.
Spain's 2026/27 forecast of 1.6 million tonnes is more than five times the Greek estimate. The data fit a market where the larger producer sets the pace, although a test of this kind shows timing and does not prove what drives it.
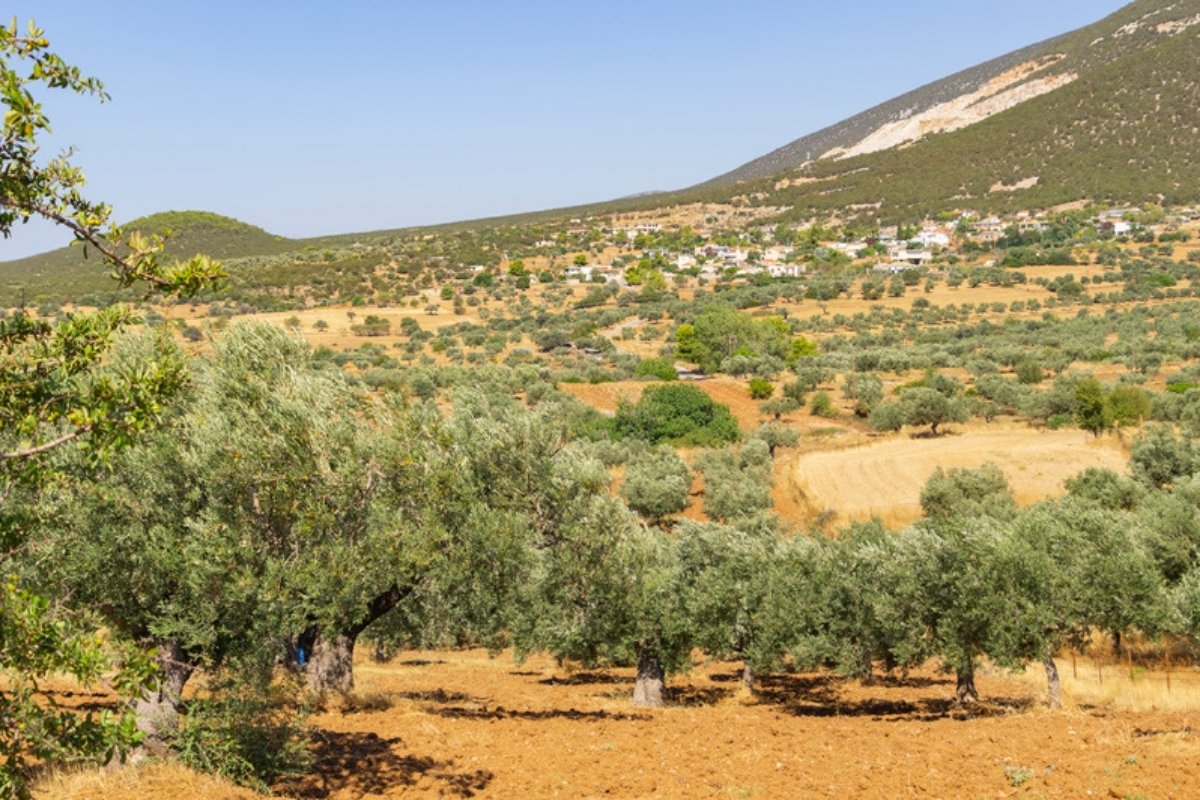
Local prices that change less often, as in many weeks in Chania and Messinia, can make Greek markets look slower to follow Spain
Messinia and Chania track Jaén more closely than Heraklion
At market level, Jaén price changes help forecast price changes in Messinia and Chania, with p-values below 0.001 at lags of one to four weeks. The link also runs the other way at market level. For Chania, the combined effect of past Jaén moves is roughly twice the effect of past Chania moves on Jaén. For Messinia the two directions are of similar strength. Heraklion shows a weaker link to Jaén, with a smaller effect and larger p-values.
Part of the Greek delay is mechanical. Chania reported an unchanged price in 59% of the weeks we tested and Messinia in 47%, against about 10% for Jaén. A price that is updated less often will appear to follow with a lag even when traders react quickly. At national level the Greek series has become more active, with unchanged weeks falling from 33% in 2005 to 2015 to 7% in 2016 to 2026, and the Spanish lead held in both periods.
The gap between Greek and Spanish prices changes every year
Greek extra virgin did not trade at a fixed premium over Spanish oil. The median Greek national average was below the Spanish one in 12 of the 22 years from 2005 to 2026. The yearly median gap ranged from €39 per 100 kg below Spain in 2023 to €49 per 100 kg above Spain in 2014, and in 2026 so far it is €9 per 100 kg above Spain. The weekly link therefore describes how changes travel, not where the two price levels sit, in a market where olive oil prices tripled over 13 years.
Greek sellers get a short window after a Spanish move
A Spanish move of 3% or more has reached Greek prices within three weeks in about three cases out of four. Greek producers and traders watching the weekly Spanish averages can treat a move of that size as an early signal. One case in four did not follow, so a Spanish move is a warning and not a guarantee.
Past Spanish falls of 3% or more reached Greek prices within three weeks in 70% of cases. On that record, the 3.3% Spanish fall in the week starting 5 October 2026 points to pressure on Greek prices by late October. The Greek price had not followed in that week. The EU Agri-food Data Portal publishes the weekly figures that show whether it does.
Sources
- European Commission, DG AGRI. (2026). Agri-food Data Portal, API guide. European Commission.