

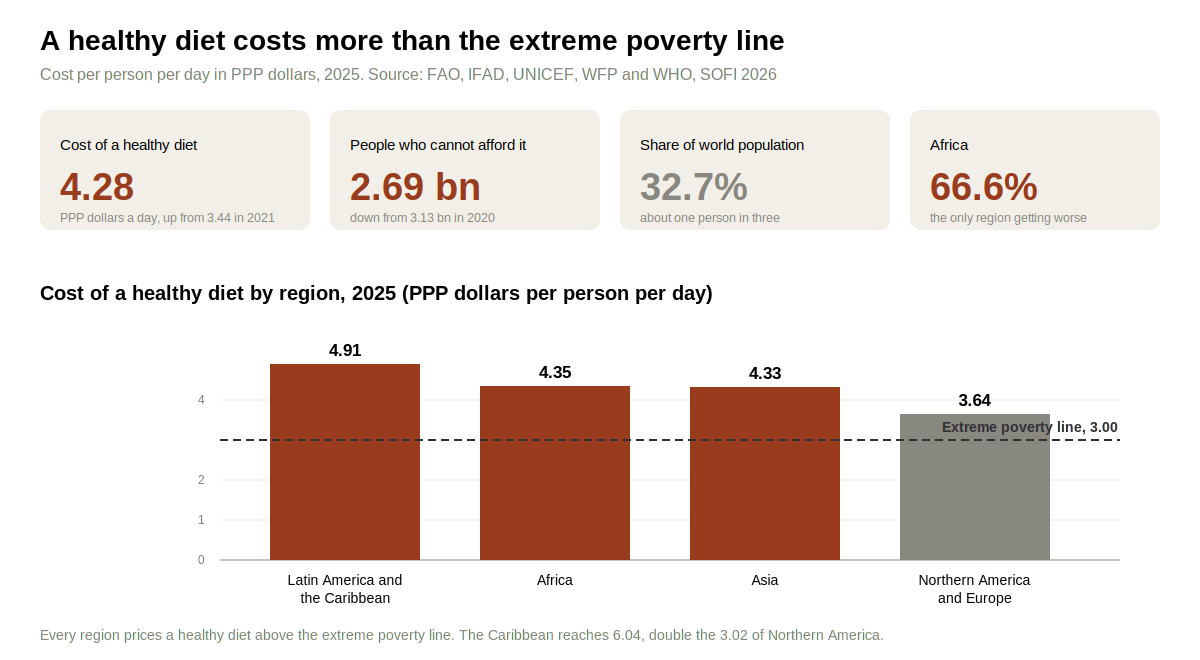
A healthy diet cost 4.28 purchasing power parity (PPP) dollars per person per day in 2025, roughly 40% more than the international extreme poverty line of 3 PPP dollars. The figure comes from the 2026 edition of The State of Food Security and Nutrition in the World, published jointly by FAO, IFAD, UNICEF, WFP and WHO, and it means about 2.69 billion people, 32.7% of the world, could not pay for one.
That number is falling. It peaked at 3.13 billion in 2020 and stood at 2.97 billion in 2021, so incomes available for food have on average risen faster than food prices since then. Africa is the exception, and the distance between it and everywhere else keeps growing.
Key takeaways
- A healthy diet cost 4.28 PPP dollars a day in 2025, up from 3.44 in 2021 and 2.94 in 2017.
- 2.69 billion people could not afford one, equal to 32.7% of the world population, down from 37.4% in 2021.
- Africa is the only region moving backwards. A healthy diet was out of reach for 66.6% of the population in 2025, more than double the shares in Asia (28.9%) and Latin America and the Caribbean (25.7%).
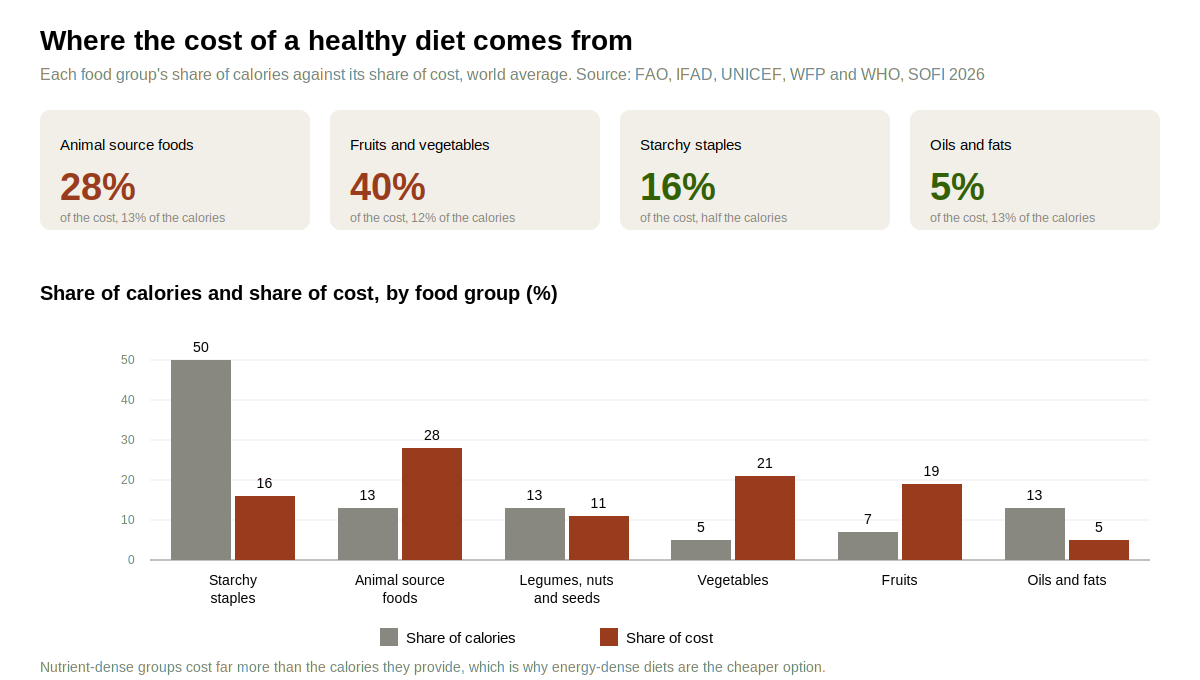
- Animal source foods, fruits and vegetables take close to 70% of the cost while supplying about a quarter of the calories.
- Starchy staples are the mirror image, providing half the calories for one-sixth of the cost.
What the cost of a healthy diet actually measures
The indicator prices a nutritional target rather than a shopping habit. FAO and the World Bank define a Healthy Diet Basket calibrated to 2,330 kilocalories a day across six food groups, then find the cheapest available item in each group in each country using retail prices collected by the International Comparison Program. The basket holds 11 items in all. Two starchy staples and two animal source foods sit alongside one item from legumes, nuts and seeds, three vegetables, two fruits and one from oils and fats.
What comes out is a floor rather than a household budget. It leaves out cooking fuel, water, the time needed to prepare meals, food grown at home, and any allowance for taste or local custom, so real spending on food is higher almost everywhere. The value of the measure lies in comparability, since the same basket logic applied in every country shows where eating well is genuinely out of reach. Affordability is then judged by setting the cost against national income distributions, after deducting what households must spend on essential non-food goods and services.
Animal source foods, fruits and vegetables carry most of the cost
Three food groups drive the total. Animal source foods account for 28% of the cost of a healthy diet worldwide, vegetables 21% and fruits 19%, close to 70% between them, while supplying only about a quarter of the basket's calories. Starchy staples run the opposite way, delivering half the calories for 16% of the cost, because grains and roots are cheap per calorie and both store and travel well. Oils and fats are cheaper still, at 5% of the cost for 13% of the calories. That arithmetic explains why energy-dense diets are easy to afford while nutrient-dense ones stay out of reach.
Regional patterns differ sharply. Animal source foods reach 35% of the cost in Africa, the highest share recorded for any group in any region, and 69% of African countries fall in the most expensive third of countries globally for that group. In Latin America and the Caribbean vegetables are the costliest group at 25%, with 65.5% of the region's countries in the top third for vegetable costs. Fruits are comparatively cheap across Africa, where 82.4% of countries sit in the lowest cost tercile, helped by locally abundant varieties.
Africa is the only region where affordability is getting worse
Unaffordability in Africa reached 66.6% in 2025, up from 66.2% in 2021, while it fell in Asia, in Latin America and the Caribbean, and in Northern America and Europe over the same period. In absolute terms the picture is starker still, with the number of Africans unable to afford a healthy diet climbing from 935 million in 2021 to 1.03 billion in 2025 as population growth outpaced any gain in affordability. Sub-Saharan Africa sits at 73.5%, and Middle Africa at 78.7%.
Income level tells much of the story. In low-income countries 76.1% of people cannot afford a healthy diet, and their number keeps rising, reaching 488 million in 2025 against 443 million in 2021. Lower-middle-income countries hold the largest absolute group at about 1.4 billion. Even in upper-middle-income and high-income countries some 750 million people are priced out, so no income group has solved this.
Cost and income also move independently. Latin America and the Caribbean carries the highest regional cost at 4.91 PPP dollars, and the Caribbean subregion the highest anywhere at 6.04, double the 3.02 recorded in Northern America. Yet unaffordability there is far below Africa's, because incomes are higher relative to that cost.
Local foods make a healthy diet substantially cheaper
Allowing each country to draw on its own cheapest available items, instead of a fixed basket of globally traded foods, lowers the cost of a healthy diet by 34% on average. The effect is largest in Africa, where the same comparison shows a 78% difference, and fruit diversity alone explains about a third of that gap. Least-cost baskets across the continent frequently include items absent from international price lists, from indigenous leafy vegetables to dates, coconuts and locally grown citrus.
This carries a practical implication for anyone working on production. Diversity in what is grown and marketed locally is not a cultural detail, it is a price mechanism, and crops that never enter global trade statistics can do more for local affordability than imported equivalents.
What actually brings the cost down
Most of what a consumer pays accumulates after the farm gate. Post-farmgate activities account for 70 to 75% of consumer food expenditure globally, and in low- and middle-income countries processing, logistics and wholesale alone make up 30 to 40% of value added. The report finds trade logistics to be among the strongest associations of all, with a 10% improvement in a country's logistics performance linked to a 5.4% lower cost of a healthy diet. Better road quality and cheaper mobile communication show the same direction of effect.
Losses along that chain feed directly into price. About 14% of food produced is lost between harvest and retail, with a further 19% wasted at retail and consumer level, and losses for fruits and vegetables run far higher than for cereals at every stage. Less than half the food that needs refrigeration worldwide actually gets it, which is why improved storage and cold chain investment does as much for affordability as any yield gain.
Where public money goes matters just as much. Roughly 70% of the USD 540 billion in annual global producer support is tied to grains, sugar, dairy, beef and oil crops, and modelling in the report shows that subsidising already cheap starchy staples raises the total cost of a healthy diet by about 0.4% globally, because it pulls land, labour and inputs away from other value chains. A 10% efficiency gain applied across all food sectors cuts the cost by 12%, and interventions in fruits and vegetables alone deliver 9 percentage points of that. Research spending directed at fruits, vegetables and legumes produces the largest long-term returns.
None of this removes the need for incomes to rise. Cost is one side of affordability and purchasing power is the other, which is why the report pairs supply-side reform with cash transfers and nutrition-sensitive social protection, and warns that stimulating demand faster than supply can respond simply pushes prices up. Energy prices sit underneath all of it, since cold chains, processing and transport make nutrient-dense foods more exposed to fuel costs than staples, a channel the 2026 conflict in the Middle East has already reopened. The link between a bad harvest, a fuel shock and what food costs in a distant market runs through exactly these stages, and it is the reason a diet cost measured in one country responds to events in another.
For all the improvement since 2020, a healthy diet still costs more than the extreme poverty line, and about one in three people cannot reach it. Closing that gap is what turns available food into real food security.
Sources
- FAO, IFAD, UNICEF, WFP and WHO. 2026. The State of Food Security and Nutrition in the World 2026. Rome.