

For more than three decades, the European Commission's Joint Research Centre has monitored crop conditions across Europe with satellite indicators that describe vegetation as a whole. Its September 2026 bulletin introduces a different approach. Using Sentinel-2 satellite imagery, the JRC's AGRI4CAST team can now follow individual crop types across Europe, and the first results focus on maize, in a season marked by widespread heat and drought stress. The JRC presented the method alongside the bulletin as a potential step change for crop monitoring in Europe.
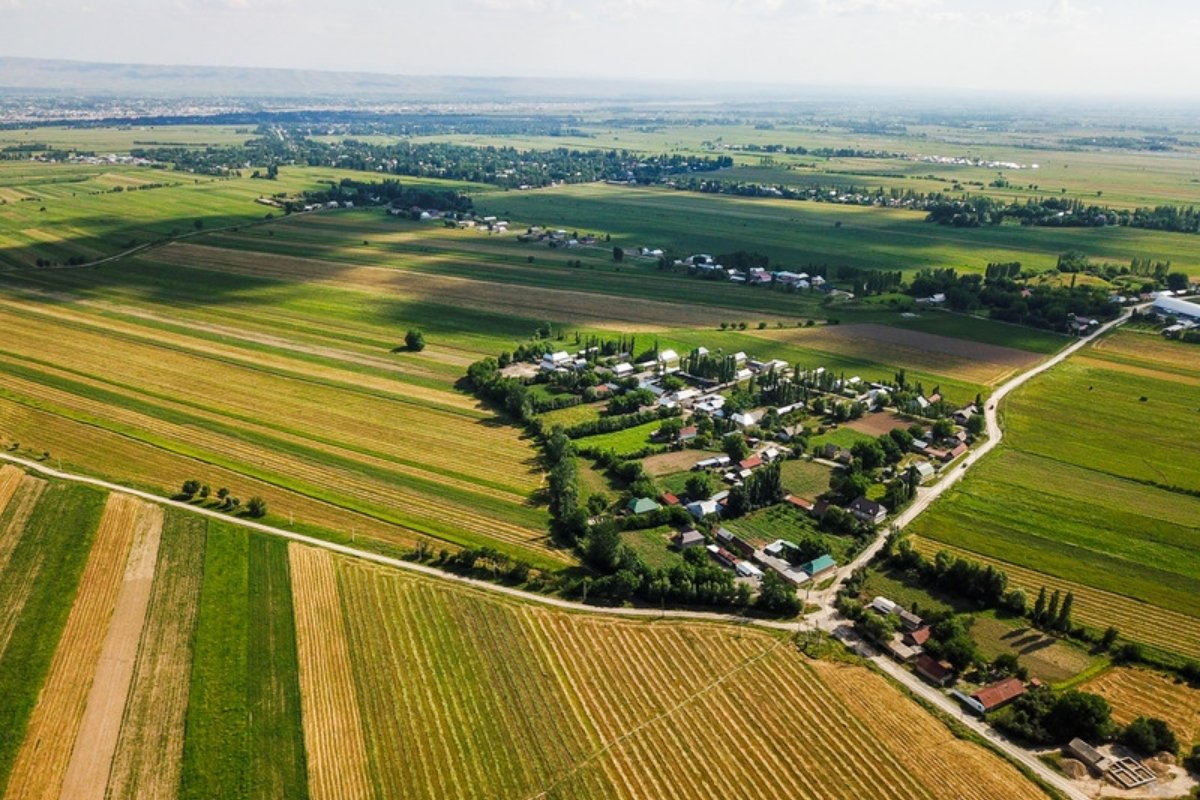
The change matters because a general vegetation signal blends everything that grows in an area. In a maize region in August, that can include harvested cereal fields, grassland and woodland alongside the maize itself. By counting only the pixels classified as maize, the new analysis describes the condition of the maize itself, and the September bulletin shows what that reveals about a very difficult season.
What the satellite measures
The indicator is fAPAR, the fraction of absorbed photosynthetically active radiation, which describes how much of the light a crop can use for photosynthesis it is actually capturing. The JRC sums the ten-day composite signal over a reference period to obtain a cumulative value, which serves as a proxy for the biomass the maize has accumulated. For the September bulletin, that period ran from 1 to 30 August 2026.
The comparison is made against the medium-term average for 2017 to 2025. Anomalies are calculated on a 10-kilometre grid, but only from Sentinel-2 pixels classified as maize in the annual crop type maps for each year from 2017 to 2026. On the resulting map, blue areas show above-average maize biomass and brown areas show below-average biomass.
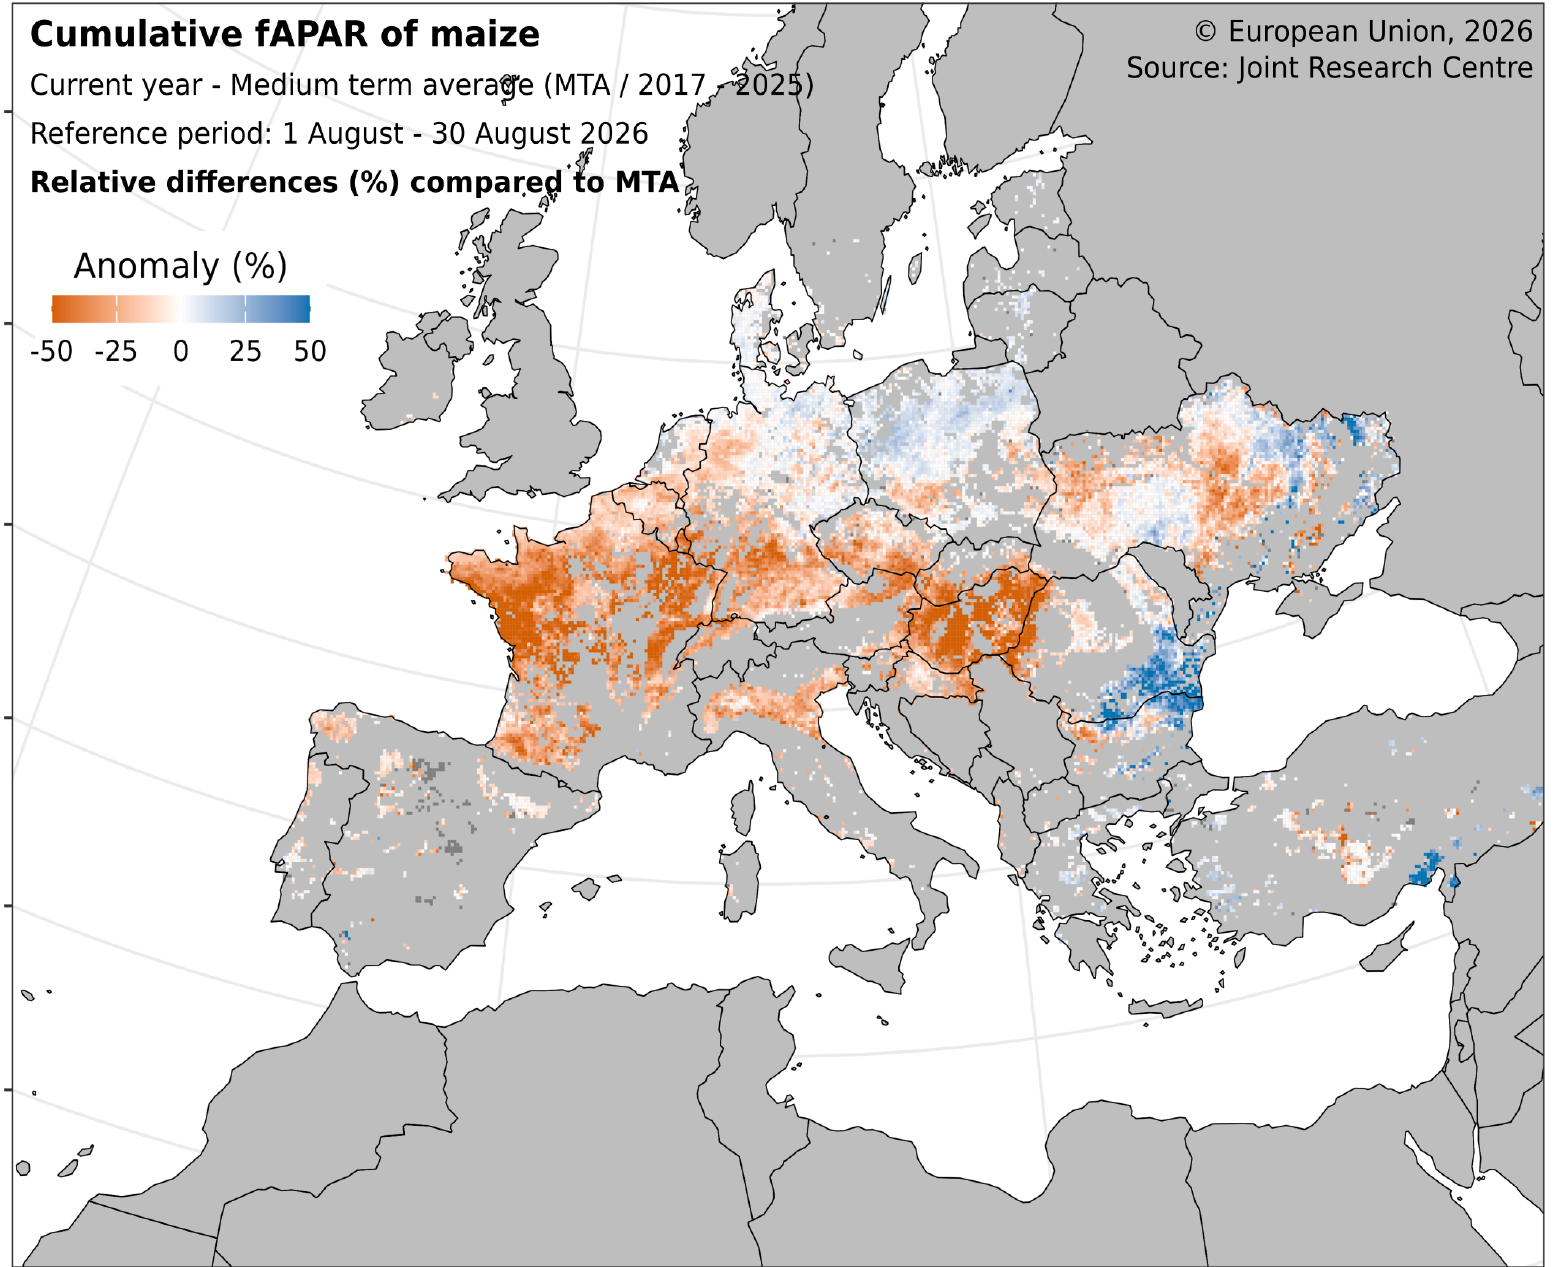
Cumulative fAPAR of maize for 1 to 30 August 2026 against the 2017 to 2025 average. Brown shows below-average maize biomass, most extensive in France, Hungary and parts of Germany and Italy, and blue shows above-average biomass, concentrated in south-eastern Romania and parts of Poland. Source: JRC MARS Bulletin Vol. 34 No. 8, © European Union, 2026.
How to read a crop signal through the season
Alongside the map, the bulletin plots the smoothed fAPAR of maize through the season for individual regions. Each chart compares three lines, the 2026 season, the previous season and the 2017 to 2025 average, and the shape of the curve carries the information. The height of the peak reflects how much green canopy the crop built, the timing of the peak shows how fast it developed, and the speed of the decline after the peak shows how early it aged.
The two regions at the top of the chart set out the contrast of the season. In Alföld és Észak in Hungary, severe drought and extreme heat advanced crop development by around two weeks. The signal stayed largely below average from June, peaked below the average curve and fell away early, which the JRC reads as poor conditions at flowering and very low biomass accumulation. In Macroregiunea Trei in south-eastern Romania, the signal followed the average until early July and then stayed above it, indicating above-average biomass.
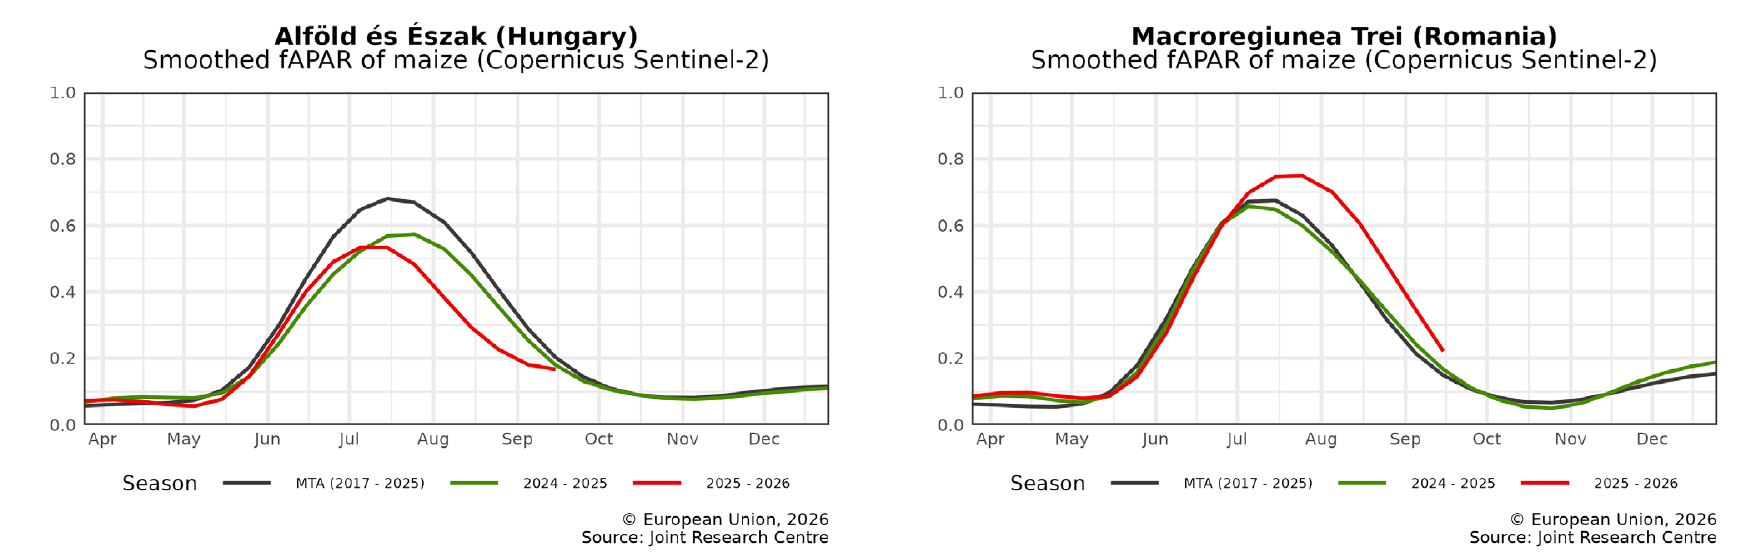
Smoothed maize fAPAR through the season. The red line is 2026, the green line the previous season and the black line the 2017 to 2025 average. Hungary peaked lower and declined earlier, while south-eastern Romania stayed above average from July onwards. Source: JRC MARS Bulletin Vol. 34 No. 8, © European Union, 2026.
What the maize signal showed across Europe
The same method explains regional differences that national averages hide. In Poland, depleted soil moisture and slightly above-average temperatures led to below-average biomass and lower yield prospects in the south, while the north had a better water supply, and maize in Północno-Zachodni stayed above average all season and flowered at the usual pace. Germany showed fair conditions in the east. In Baden-Württemberg in the south-west, the signal matched the average until July, when the flowering peak arrived close to two weeks early, and then dropped below it.
France followed a similar path more severely. Sowing and early development went well until May, but repeated heatwaves and drought from June to early August kept the signal largely below average, and flowering came about two weeks early, as the Grand Est region shows. The JRC links that very low signal to yield prospects at record lows in most French regions. In Italy, biomass built up well until flowering, then fell sharply from around mid July in the Nord-Ovest region as water and heat stress struck during the reproductive stages, and the crop reached maturity about two weeks early.
On the map, the main maize areas of northern Greece show no strong negative anomaly, which fits the JRC's unchanged Greek maize forecast of 1% above the five-year average.
The method already reaches beyond maize
Although maize is the first published case study, the bulletin already uses the crop-specific analysis elsewhere. In Denmark and Sweden, it shows that potatoes fared relatively well during the dry summer while sugar beet was more negatively affected, particularly in Sweden. In the Baltic countries it confirms that spring barley and summer crops are faring well despite excess rain, with especially positive spring barley prospects in Finland. In Romania it confirms favourable summer crop conditions in the east along the Danube, which the JRC attributes partly to the increasing use of irrigation.
Earlier warning for farmers and policymakers
The JRC places the new approach within a wider aim. It argues that better crop monitoring and a longer time horizon for yield forecasts can detect emerging risks earlier and give farmers and policymakers more time to prepare. Its MARS forecasting system already combines satellite observation, meteorological data and forecasts, crop growth models, agricultural statistics and expert knowledge, and its MARS Explorer and Atlas provide near-real-time weather and crop condition maps at 10-kilometre resolution.
The work also feeds international monitoring. It contributes to MED-AMIN, a network that helps Mediterranean countries build crop monitoring and early warning systems, and to the GEOGLAM Crop Monitor for the G20's Agricultural Market Information System hosted by FAO. At farm level, the same principle of following one crop through its own season underpins the satellite tools already used in precision agriculture, and the JRC's move brings that crop-by-crop view to European-scale forecasting.
Sources
- European Commission Joint Research Centre. (2026). JRC MARS Bulletin, Crop monitoring in Europe, September 2026, Vol. 34 No. 8. Section 3.2, maize-specific analysis. 28 September 2026.
- European Commission Joint Research Centre. (2026). European agriculture hit hard by exceptionally hot and dry summer. 28 September 2026.