


In October 2026 Thai white rice with 5% broken grains cost $489.0 per tonne and Vietnamese rice of the same specification $413.9, so the gap between the two origins reached $75.1 per tonne, the third widest for any October since 2010, according to a Wikifarmer analysis of World Bank monthly commodity prices. A year earlier, in October 2025, Vietnamese rice was the dearer of the two by $9.6, while in the eight cases since 2010 in which the gap rose above $70 after at least six months below that level, it was smaller six months later in five and wider in three.
October's gap is the third widest for the month since 2010
In the sixteen Octobers from 2010 to 2025 the median gap between Thai and Vietnamese rice was $18.35 per tonne, and only October 2012, at $104.6, and October 2019, at $98.2, were wider than this year (World Bank). In five of those Octobers, 2014, 2021, 2023, 2024 and 2025, Vietnamese rice cost more than Thai rice, and the widest reverse gap came in October 2023, when Thai rice was $26.2 cheaper.
During 2026 the gap ranged from $35.2 in March to $102.7 in June, and it was above $70 in three months, June, July and October. It was $60.1 in August and $63.5 in September before rising again to $75.1 in October. Taking all months from 2010 to 2025 rather than Octobers only, the median gap was $35.45, so by that measure too October's gap was more than twice the usual level.
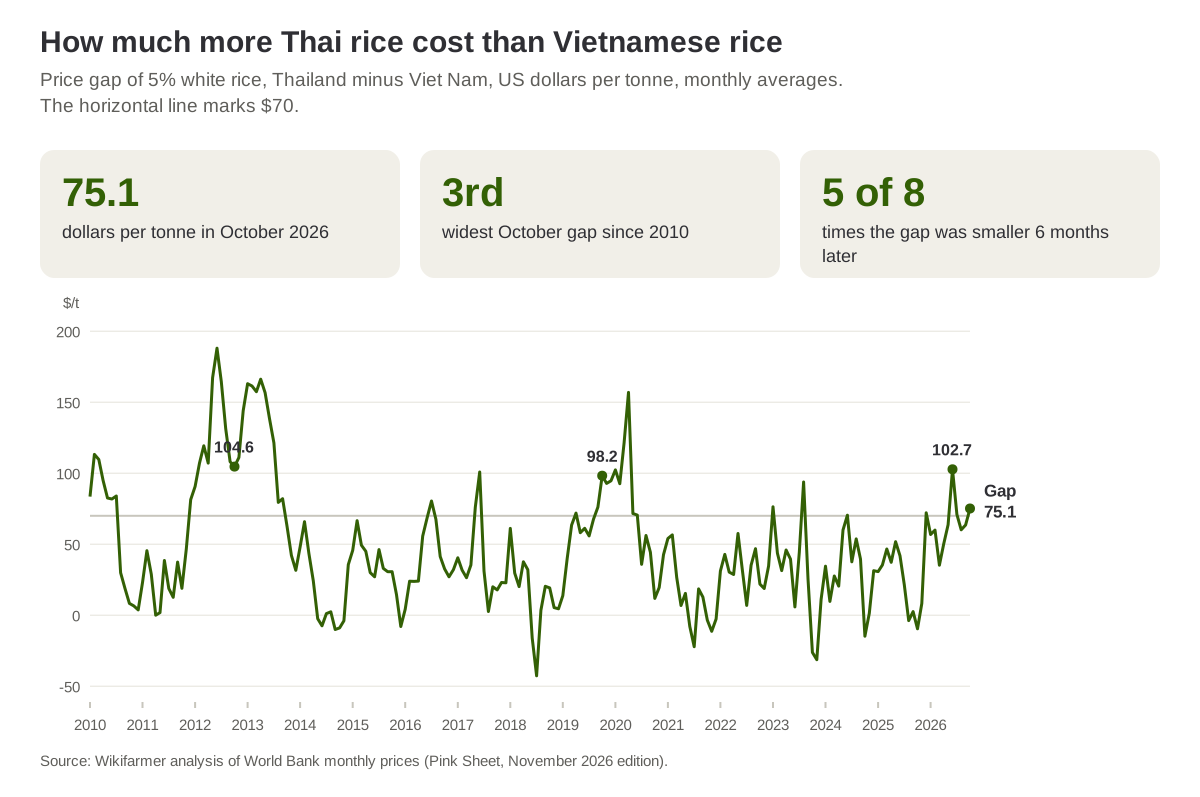
Source: Wikifarmer analysis of World Bank monthly prices (Pink Sheet, November 2026 edition). The gap is the Thai price minus the Vietnamese price, in US dollars per tonne. The horizontal line marks $70.
Six months after eight wide gaps the gap was smaller in five
Since 2010 the gap has opened to $70 or more, after staying below that level for at least six months, eight times, most recently in December 2025. Six months later it was smaller in five cases, those of July 2016, May 2017, January 2023, August 2023 and June 2024, and wider in three, those of December 2011, April 2019 and December 2025. The August 2023 episode began in the first month after India banned exports of non-basmati white rice, with a gap of $93.8 that had narrowed to $9.7 six months later.
In the most recent episode the gap widened, from $72.1 in December 2025 to $102.7 in June 2026, although in between it had dropped to $35.2 in March. Under the six-month rule October 2026 does not count as a new episode, because the gap had been above $70 in June and July. With eight cases, a split of five to three is not enough to stand out from what chance would produce.
| Month the gap opened | Gap ($/tonne) | Gap 6 months later | Thailand, change over 6 months | Viet Nam, change over 6 months |
| December 2011 | 81.4 | 188.0 | +2.4% | -18.3% |
| July 2016 | 80.4 | 40.4 | -14.7% | -6.9% |
| May 2017 | 76.0 | 23.0 | -4.5% | +9.9% |
| April 2019 | 71.9 | 98.2 | +2.7% | -4.5% |
| January 2023 | 76.3 | 44.2 | +5.8% | +14.1% |
| August 2023 | 93.8 | 9.7 | -1.7% | +13.5% |
| June 2024 | 70.4 | 31.3 | -16.6% | -11.7% |
| December 2025 | 72.1 | 102.7 | +16.5% | +11.2% |
Source: Wikifarmer analysis of World Bank monthly prices (Pink Sheet, November 2026 edition), in US dollars per tonne, not adjusted for inflation. The gap is the Thai price minus the Vietnamese price of 5% broken white rice. The month the gap opened is the first month with a gap of $70 or more after at least six months below that level.
Each of the two prices was higher six months later in half the cases
The gap narrowed in different ways, sometimes through a fall in the Thai price, as after July 2016, and sometimes through a rise in the Vietnamese price, as after August 2023, so the wide gaps give no direction for either price. Six months after the eight episodes the Thai price was higher in four and the Vietnamese price also in four, while across all months from 2010 to 2025 the Thai price was higher six months later in 51.6% of cases and the Vietnamese price in 49.0%. After a wide gap, then, the two prices rose about as often as they do in any six-month period.
Six months after June 2024 the Thai price was 16.6% and the Vietnamese price 11.7% lower, while six months after December 2025 they were 16.5% and 11.2% higher respectively. In four of the eight episodes the two prices moved in opposite directions, with the largest divergence after December 2011, when the Thai price rose 2.4% and the Vietnamese price fell 18.3%, so that the gap reached $188.0.
An episode is the first month the gap reaches $70 after six months below
The World Bank series are monthly averages of export prices for Thai and Vietnamese white rice with 5% broken grains, free on board in Bangkok and Hanoi, in US dollars per tonne and not adjusted for inflation. The gap is the Thai price minus the Vietnamese price. An episode is the first month with a gap of $70 or more after six months below $70, and only episodes from 2010 to 2025 are counted, so that the six following months are available. Changes over six months are measured from the price of the month the gap opened, and the comparison with all months covers the 192 months from January 2010 to December 2025. The analysis does not examine the causes of the gap, and the World Bank's monthly prices may be revised.
The gap matters to rice importers and growers
Thailand and Viet Nam are among the largest rice exporters, and the two World Bank prices are export prices for white rice of the same specification, 5% broken grains, so their gap shows how much dearer one origin was than the other for a buyer who can choose. It matters to countries that cover part of their needs through imports, to traders comparing the two origins and to growers in both countries, while the prices consumers pay and growers receive in each country also depend on the currency, freight, tariffs and quality. Across world food prices as a whole, the FAO Food Price Index fell 1.2% in October compared with September.
In the eight episodes the gap was smaller six months later in five and wider in three, while the direction of each price did not differ from that of any six-month period. In the coming months, the World Bank's monthly prices for November and December will show whether the gap stays above $70, as in June and July, or returns towards the $60 of August and September. The figures describe what prices did in the past and are not a forecast.
Sources
- World Bank. (2026). Commodity Markets, Pink Sheet monthly prices. World Bank Group.