")

In the past few weeks, the media has been saturated with information about the recent wave of tariffs that the Trump administration has announced on different countries and markets/products. Multiple sectors are feeling the ripple effects, but the agrifood industry stands particularly exposed. We have been hearing economists and policy and trade experts debate about the macroeconomic implications, yet one thing remains certain: consumers will feel the changes at the supermarket counter. In this article, we will break down what tariffs are and how they affect the grocery bill.
What Are Tariffs, Really?
Tariffs are not a new practice in global trade. They have historically been used as a tool to protect domestic industries from foreign competition. When governments make an imported good more expensive, they aim to encourage consumers and businesses to purchase locally produced products, enhancing domestic production and job creation. In fact, in ancient Greece, the Athenian authorities imposed a fee on imported grains that passed through the port of Piraeus.
Basically, tariffs are taxes charged on goods imported from other countries. For example, when the United States placed a tariff of 10% on coffee from Colombia, means that a shipment that costs $1,000 will now cost 1,100. Companies that bring foreign goods into the country have to pay the tax to the government. But the reality is that this extra cost downstream to the consumers, since it's rarely absorbed by importers only. The additional expense will pass down the supply chain, resulting in higher retail prices.
However, President Trump’s recent tariff implementation significantly contradicts the concept of tariffs in the global trade community. The current tariff structure, announced in April 2025, established a baseline 10% tariff on imported goods from all countries and significantly higher "reciprocal tariffs" on specific countries, including 34% on China, 46% on Vietnam, and 20% on European Union countries.
Where will consumers notice the rising prices first?
Food analysts predict consumers will feel the impact first in fruits and vegetables. Fresh produce requires frequent restocking due to its perishable nature, which means that shipments affected by the new tariffs will arrive quickly.
Fresh Produce
Price tags on bananas from Guatemala and grapes from Peru will reflect the 10% tariff before the end of April. Avocados and other Mexican produce could see price increases between 10% and 20% at the retail level.
Winter berries, 67% of which come from Mexico, will see price fluctuations between 10% and 25%, hitting consumers particularly hard during off-season months. In most regions, U.S. farms can’t grow strawberries, blueberries, raspberries, and blackberries year-round, so Mexican imports fill crucial winter and early spring gaps.
Tomatoes are another product vulnerable to tariffs. U.S. tomato imports reached a record 3.9 billion pounds (1.7 billion kilos) from January to October 2024, with Mexico supplying 90% of this amount. This import dependence increased dramatically after Hurricane Milton devastated Florida's domestic production, causing fresh tomato yields to drop by 81% year-over-year in November 2024.
Seafood
Beyond fresh produce, many product categories will experience relatively immediate price changes. Seafood, for instance, faces the biggest tariff exposure. Seafood imports in the U.S. have seen a significant rise since 2009, estimated in 2020 at 30 billion dollars. The top exporters to the U.S. are Vietnam and India, which now face high tariffs of 46% and 26%, respectively. Shrimp, which previously enjoyed zero duties, will likely become noticeably more expensive.
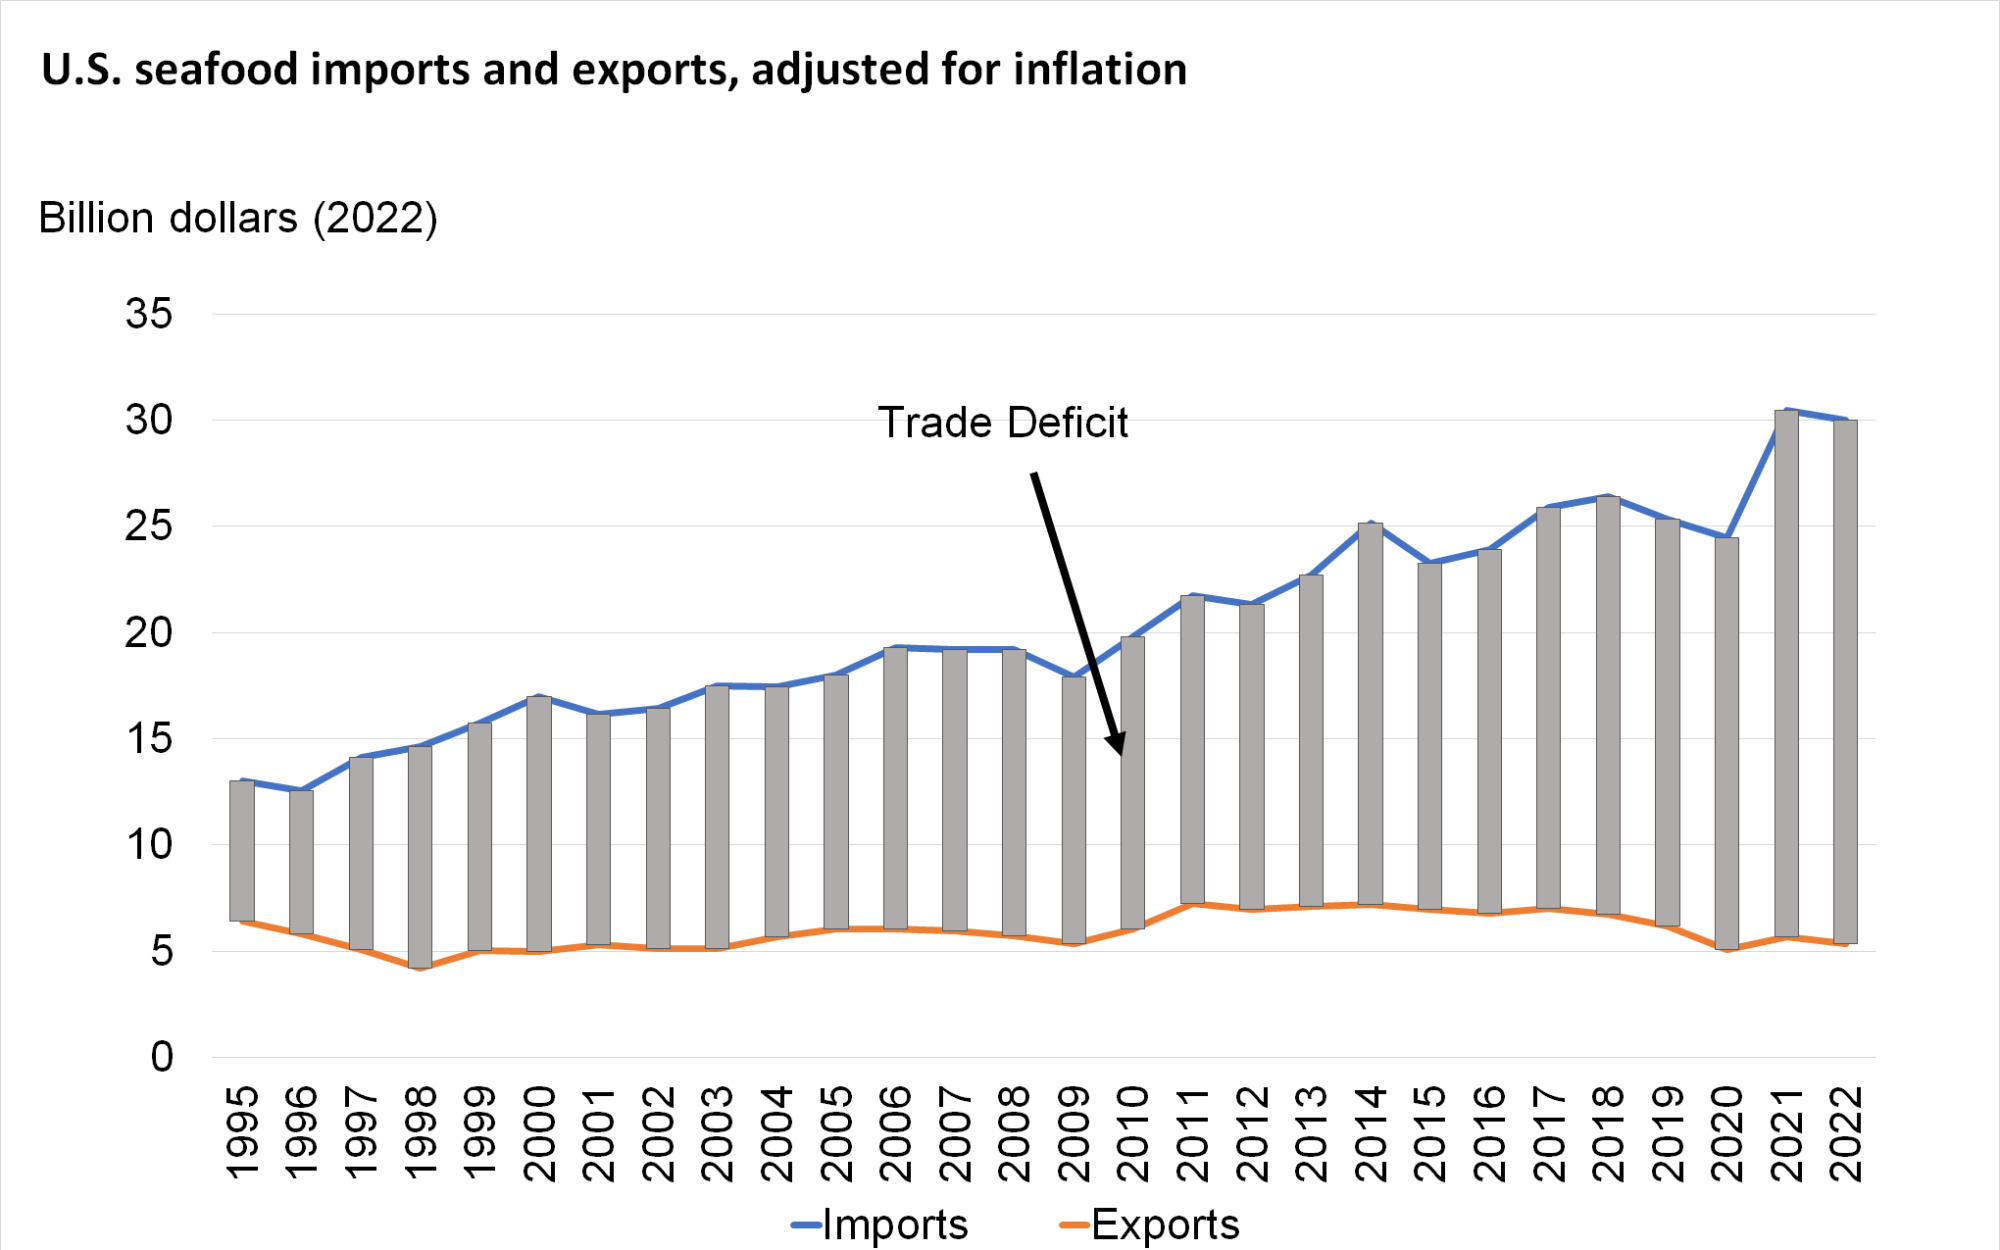
Source: USDA
Coffee and Wine
Coffee is another product that will face significant price fluctuations. The U.S. is the biggest importer of coffee in the world, with importing values around 8.2 billion dollars. The U.S. sources 80% of its coffee beans from Latin America, mainly from Brazil and Colombia. Even with the relatively lower 10% tariff applied to these nations, coffee prices (already at record highs) are expected to climb another 10-35%, especially for specialty beans. European wines facing a 20% tariff will similarly see shelf price increases. US wine imports make up approximately 37% of the total US market, with European Union countries providing 72.3% of those imports. This means European wines account for roughly 26.7% of the total US wine consumption by volume.
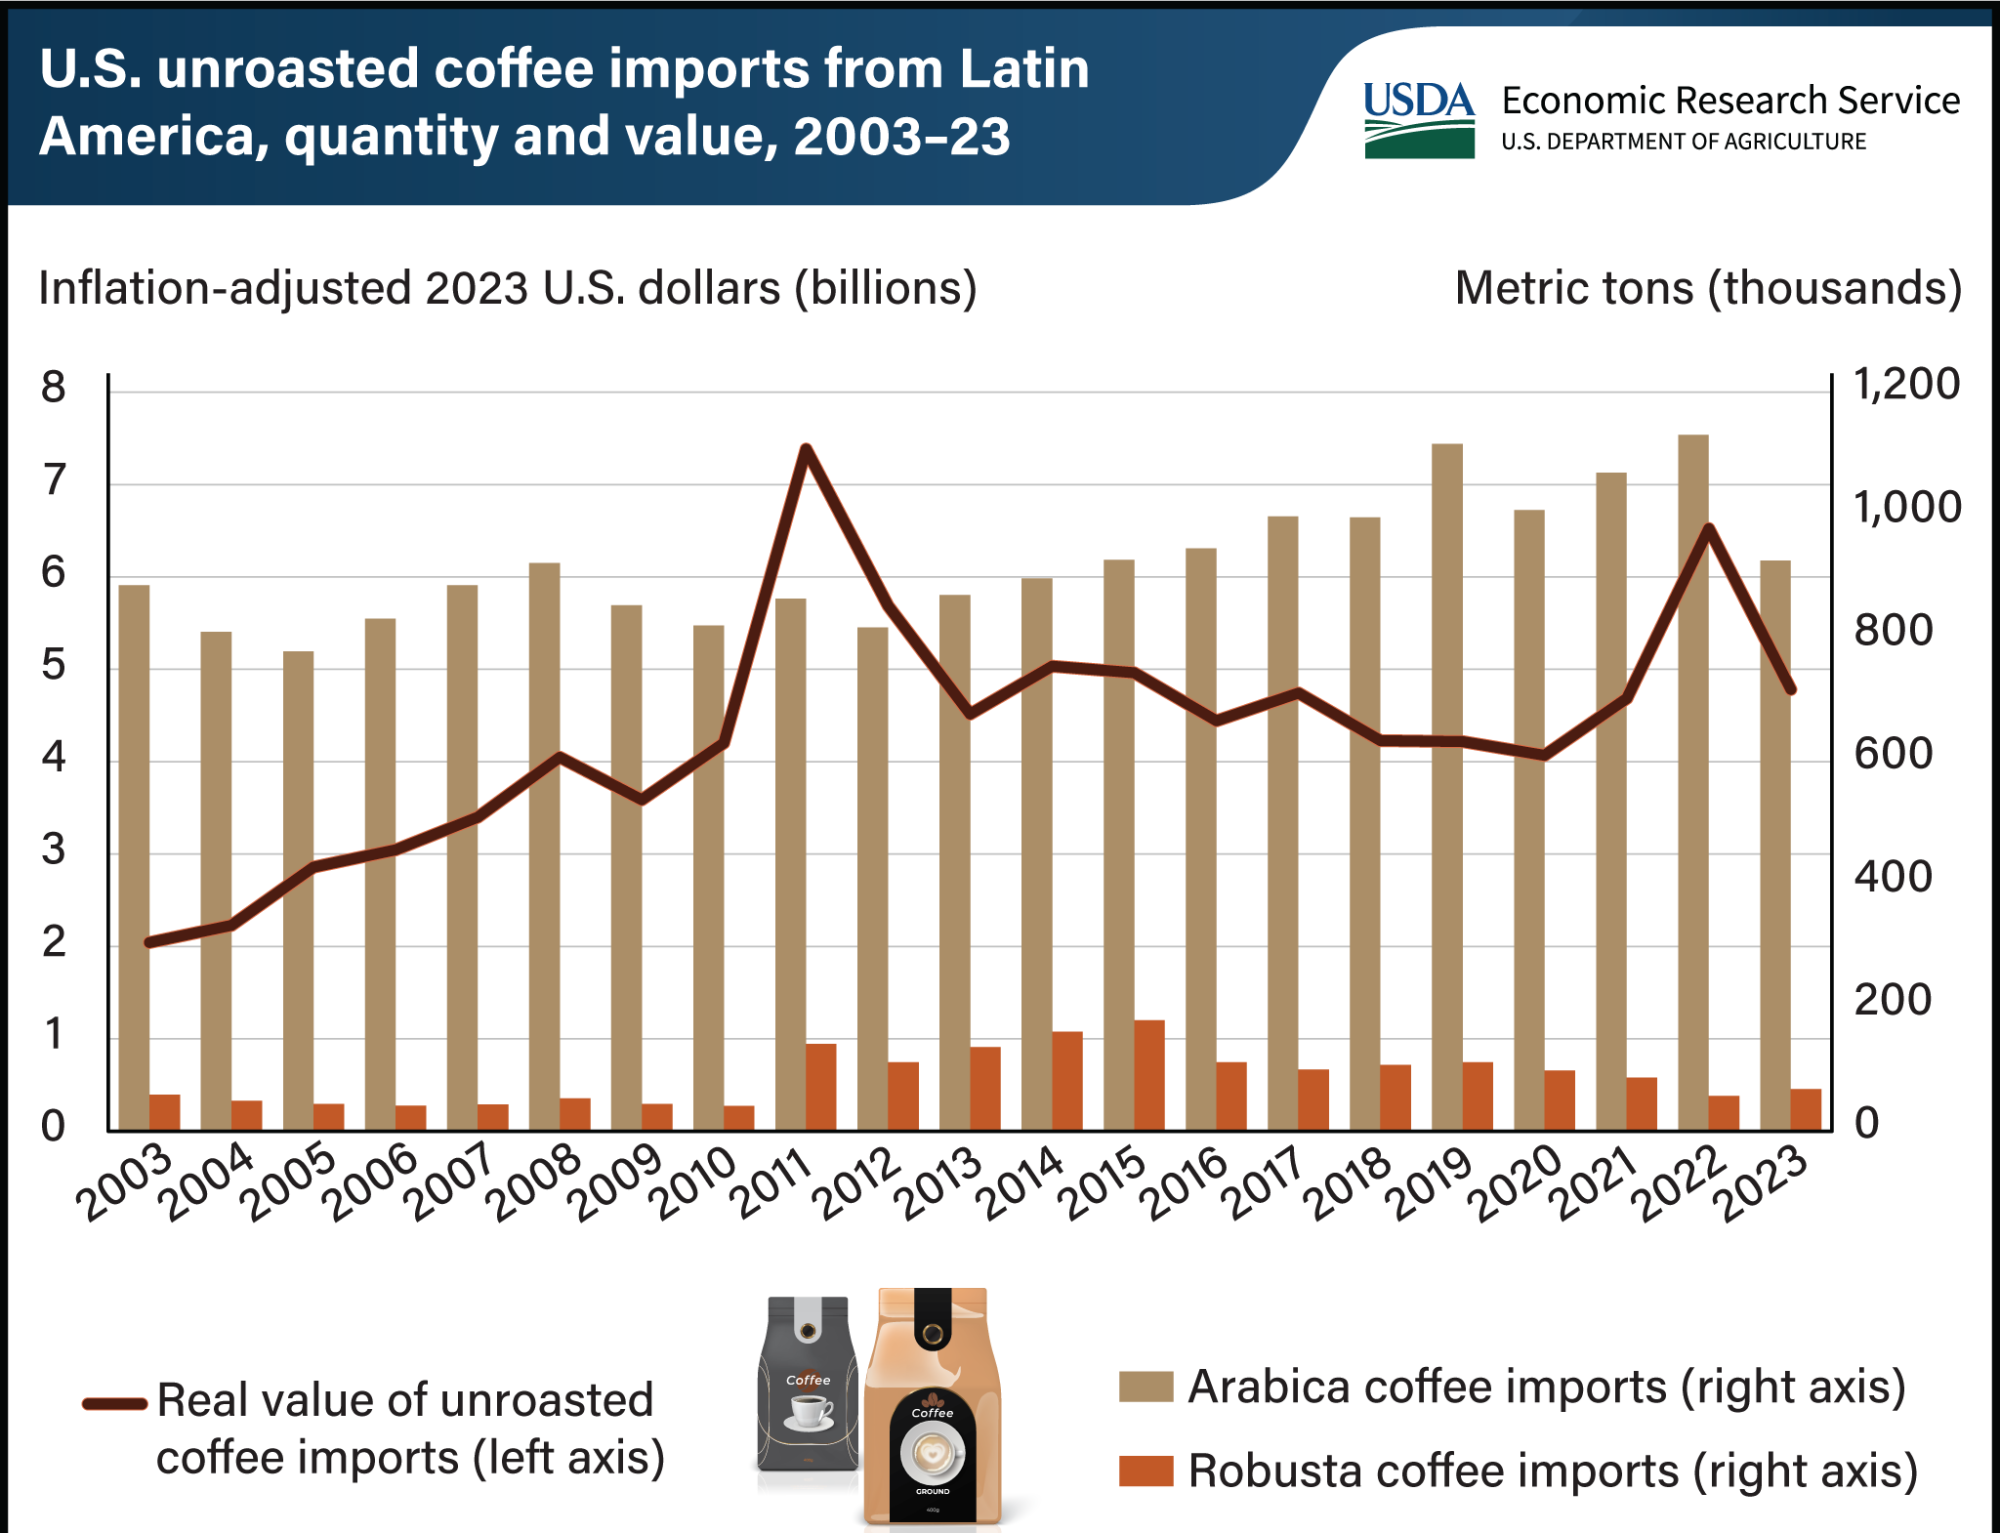
Source: USDA
European Specialties
As the US prepares to impose 20% tariffs on a wide range of European food and drink exports starting April 9th, retail prices will start to rise at supermarket shelves. For American consumers, this means that many specialty foods from Europe are about to become noticeably more expensive, potentially turning everyday ingredients hard to find at affordable prices.
High-value European products like Parmigiano-Reggiano, Pecorino Romano, and Greek feta, all well-known for their quality and origin, will be affected. Italian cheese exports are already seeing a 20% value drop under previous tariffs, and producers warn of further disruption. For example, Pecorino Romano, with a whole-sail price of $13.64 per kilo, would see its price jump to $16.37 under the new tariffs.
Parmigiano-Reggiano, when Trump introduced a 25% tariff back in 2019, saw its price on the shelves spike from $40 to $45 per kilo. Fortunately, the tariffs were then suspended on March 6, 2021, and did not create any problems for us in terms of sales. And, today the situation is similar, with prices expected once again to fluctuate.
Irish butter, especially the popular Kerrygold brand (now the second best-selling butter in the US), is also on the tariff list. Currently, it is priced between $9.54 and $9.79 per pound in US supermarkets like Walmart and Target and is projected to cost $11.75 (€10.66) after the tariffs hit.
European producers dominate the US olive oil market, with the European Union serving as the primary supplier to American consumers. The European Union supplies approximately 252,000 tonnes per season, representing roughly 70% of total US olive oil imports. For table olives, the US imports 150,000 tonnes per season. Spain (39%), Greece (25%), and Morocco (10%) are the main suppliers.
Domestic Production Cannot Meet America's Needs
The fundamental reality is that U.S. agriculture simply cannot produce many foods Americans consume daily, regardless of tariff incentives. The U.S. climate severely restricts the cultivation of staple ingredients in the American diet, such as coffee, cocoa, and tropical fruits. The U.S. imports 99% of its coffee beans, yet 63% of American adults drink coffee daily.
From 2007 to 2023, the U.S. fresh fruit availability supplied by imports grew from 50% to 59% and for fresh vegetables form 20% to 35% (excluding potatoes, sweet potatoes, and mushrooms). The import share increased by more than 20% during this period for 10 crops: asparagus, avocados, bell peppers, blueberries, broccoli, cauliflower, cucumbers, raspberries, snap beans, and tomatoes.
These data show clearly that consumers will not have many domestic alternatives to counter the increasing prices. They will either need to absorb the higher costs or significantly adjust their consumption habits.
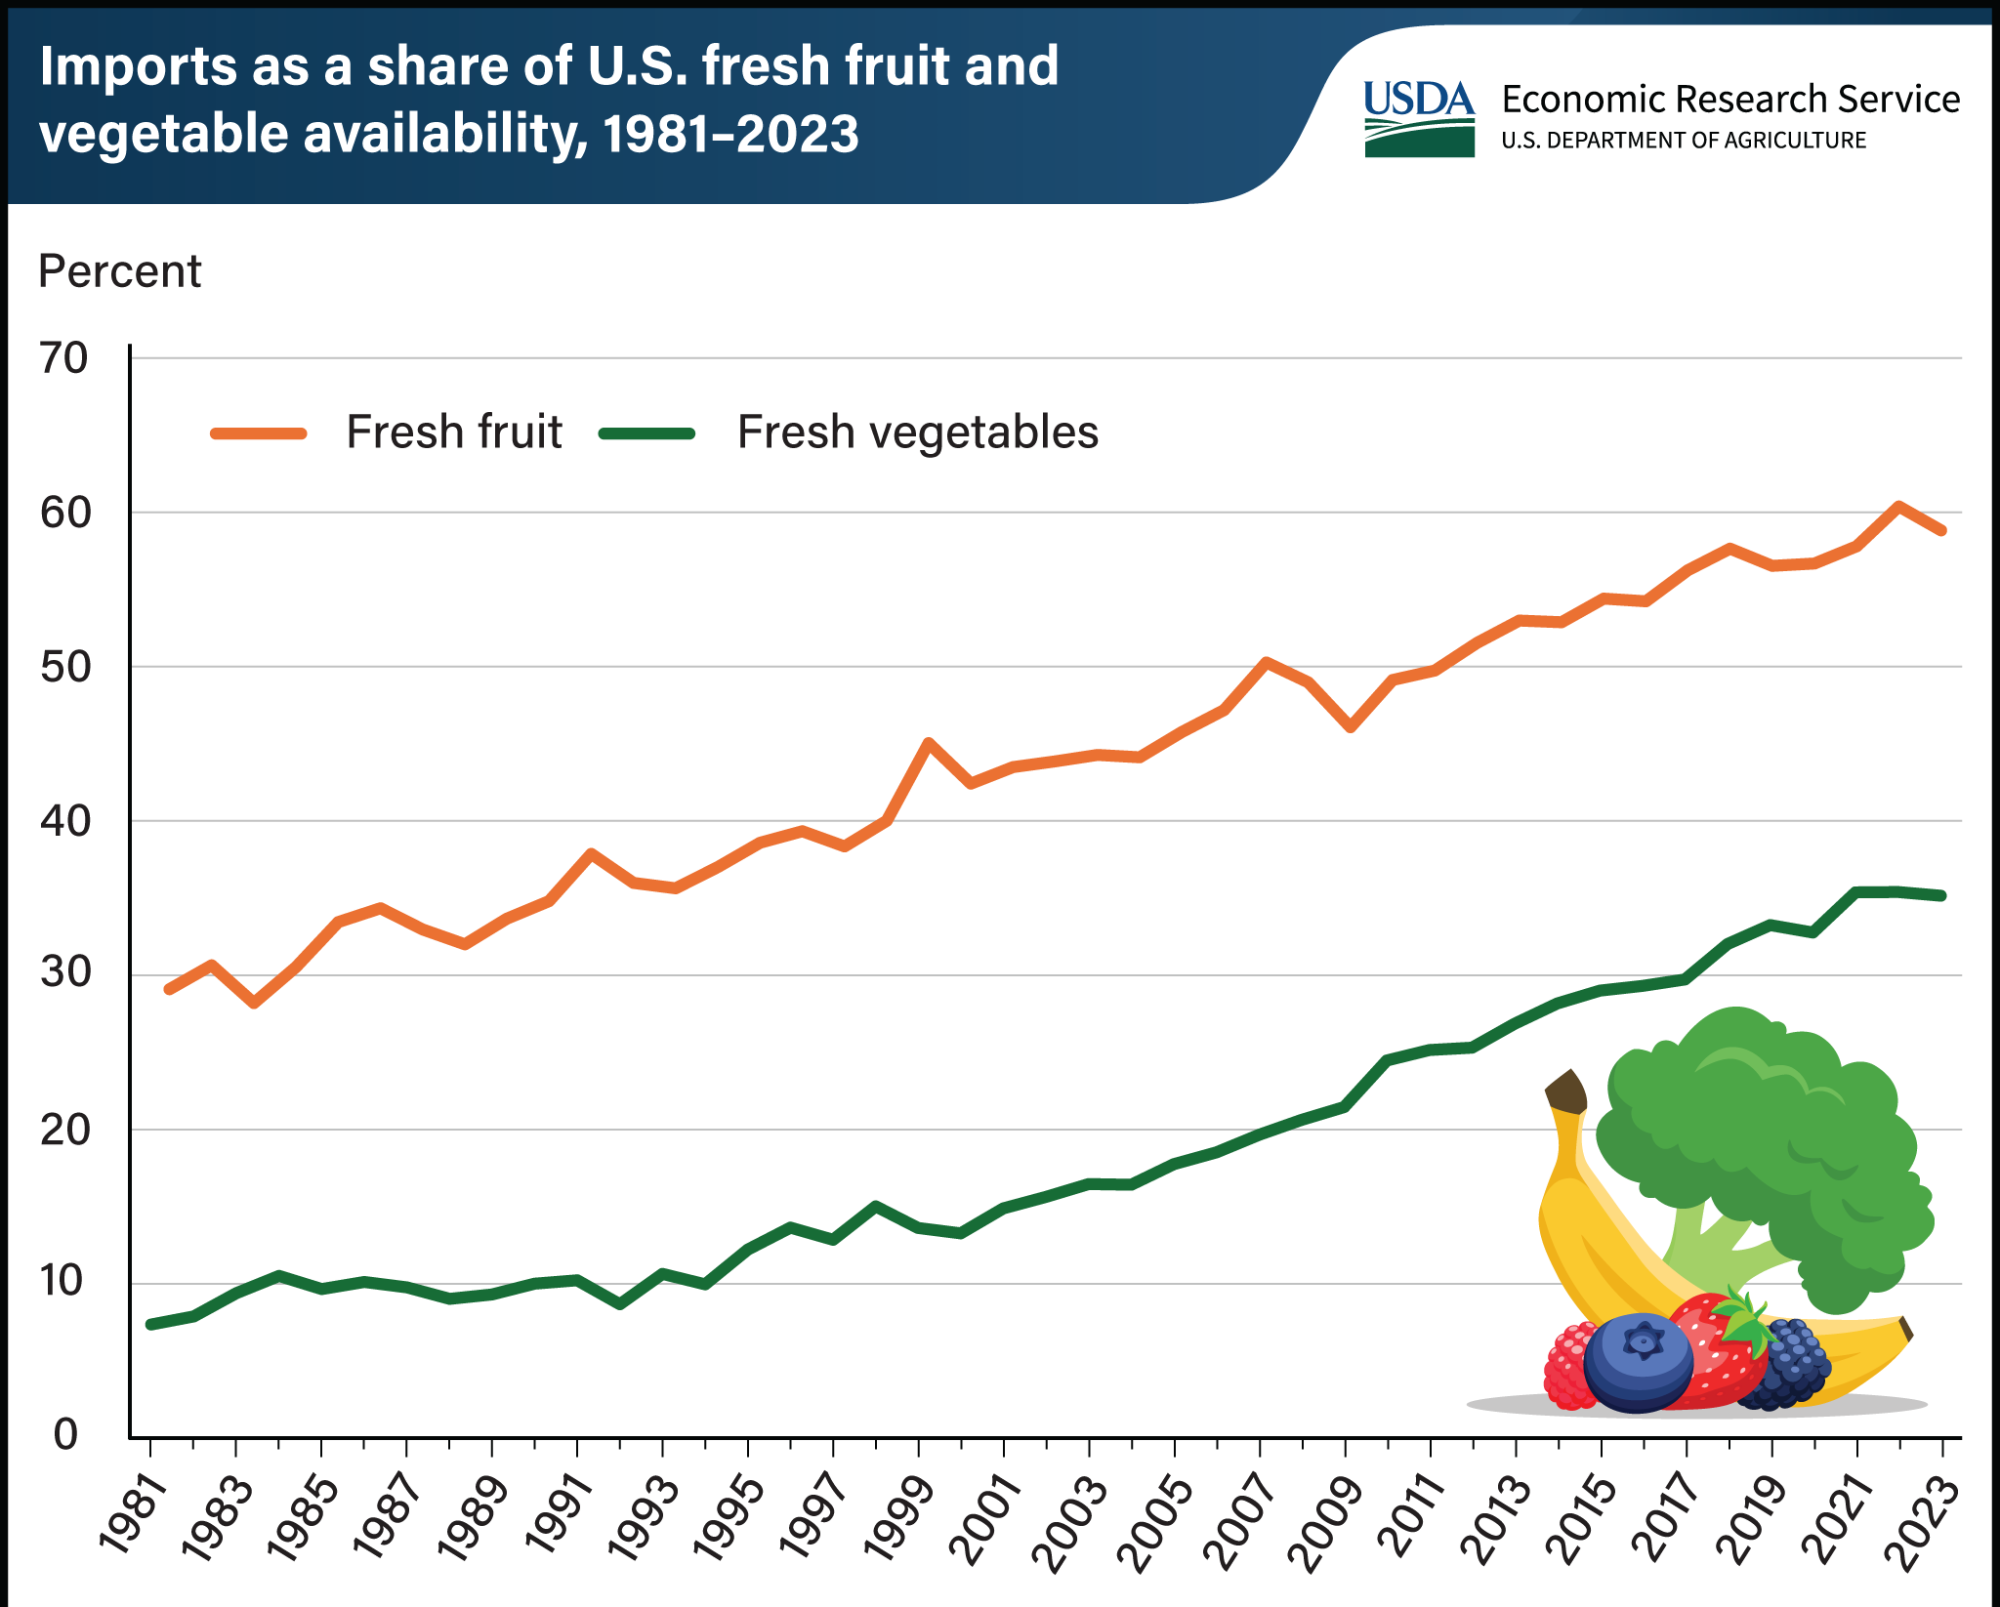
Source: USDA
The Consumer's New Reality
Food industry expert Phil Lempert estimates that "nearly half of the products in a supermarket (around 40,000 items) will be influenced by these tariffs, whether it's the whole product or just a component." The Yale Budget Lab projects that food prices will increase by 2.8% following full implementation.
Importantly, these price increases won't affect all consumers equally. Analysis shows tariffs tend to be regressive, meaning lower-income households bear a proportionally larger burden. Estimates suggest households in the lowest income group could see after-tax income reduced by 1.37% due to tariff effects, compared to 0.95% for those in the highest percentile.
Beyond immediate price effects, consumers may notice:
- Reduced product selection as retailers adjust inventory strategies
- More promotion of domestic alternatives where available
- Increased emphasis on store brands as a cost-saving measure
- Potential supply gaps for certain seasonal products
How Consumers Are Responding
Recent polling reveals the increasing concern about these developments among consumers. Approximately 76% of consumers worry about tariffs' impact on prices, while 75% want elected officials to prioritize reducing inflation and grocery costs.
The most popular adaptive strategies among those who participated to the poll are:
- 41% plan to hunt more aggressively for sales and coupons
- 30% intend to purchase fewer imported goods
- 26% will seek American-made alternatives
- 23% are stocking up before prices increase further
Looking Ahead: Uncertainty and Ongoing Developments
The full effect of the tariffs is yet to come as the broader picture remains fluid. Changes happen daily, and several negotiations are on the table and countries affected by the new tariffs have already been discussing potential countermeasu-res. Industry leaders, policymakers, and trade partners are watching closely and so should do consumers. Staying up-to-date will be key in facing effectively the transformation of global trading.
References
- https://www.reuters.com/world/china/china-files-complaint-with-wto-over-new-us-tariffs-2025-04-04/
- https://www.elibrary.imf.org/view/journals/001/2023/005/article-A001-en.xml
- https://taxfoundation.org/taxedu/glossary/tariffs/
- https://www.foodnavigator.com/Article/2025/04/03/tariffs-food-and-beverage-industry-reacts/
- https://www.nytimes.com/2025/04/03/dining/grocery-stores-tariffs.html
- https://www.forbes.com/sites/phillempert/2025/04/03/bracing-for-change-the-impact-of-trumps-tariffs-on-foods--beverages/
- https://www.npr.org/2025/04/04/nx-s1-5351324/tariffs-higher-grocery-prices-trump
- https://www.ers.usda.gov/data-products/charts-of-note/chart-detail?chartId=110079&ref=thepourover.coffee
- https://budgetlab.yale.edu/research/where-we-stand-fiscal-economic-and-distributional-effects-all-us-tariffs-enacted-2025-through-april
- https://www.ers.usda.gov/data-products/charts-of-note/chart-detail?chartId=110713


