")

Global avocado trade keeps climbing, led by demand in the United States and the European Union, and that growth has put the crop's environmental record under scrutiny. A 2026 FAO study reviewing 16 footprint assessments across the main exporting countries found avocado carbon intensity ranging from 0.29 to 3.75 kg CO₂e per kilogram of fruit from the farm to the export gate, and a world average water footprint of about 1,086 m³ per tonne. For growers and exporters, these numbers now carry weight in two directions at once. They decide market access as retailers and new regulations ask suppliers to disclose environmental data, and they point to where input use, energy, and water can be trimmed to cut both impact and cost.
This article sets out how the two footprints are measured, where avocado emissions and water use actually come from, what the figures look like by country, and why the same number can mean very different things depending on where the fruit was grown.
Why avocado footprints matter for growers and exporters
Two pressures are driving avocado producers to measure their footprints. The first is trade. Buyers in high-value markets increasingly require carbon and water footprint reporting from suppliers, and sustainability rules such as the EU Corporate Sustainability Due Diligence Directive (CSDDD) ask companies to account for environmental impacts across their supply chains. National programmes reinforce this. Peru runs a water footprint certification through its National Water Authority, and Colombian exporters work within B Corp-aligned schemes tied to Law 1901 of 2018.
The second pressure is operational. Footprint assessments show producers, packers, and transporters which steps in the chain contribute most to emissions and water depletion. Acting on those results can lower the use of agrochemicals, fuel, energy, and water, which reduces cost as well as impact. The same measurement that satisfies a retailer's reporting request also flags where an orchard is wasting nitrogen or pumping more groundwater than it needs.
For a sense of scale, emissions tied to a single commodity can reach up to 10% of a producing country's total agricultural emissions where that crop dominates national output and trade.
How the two footprints are measured
Carbon and water footprints answer different questions and use different methods, so they are reported separately. Most of the studies FAO reviewed (9 of 16) used a full life cycle assessment (LCA) approach, tracking activities from input production through to the import market and, in some cases, final consumption.
Carbon footprint scopes and methods
Greenhouse gas results are reported in carbon dioxide equivalent (CO₂e), which converts gases such as methane and nitrous oxide into the amount of CO₂ that would cause the same warming over a 100-year period. Emissions are grouped under the GHG Protocol into three scopes:
- Scope 1 covers direct emissions from sources the company owns or controls, such as on-farm fuel combustion and company vehicles.
- Scope 2 covers indirect emissions from purchased electricity or heat.
- Scope 3 covers all other indirect emissions across the value chain, including fertilizer manufacturing, transport, and product use. It is usually the largest and hardest to measure.
The figures are expressed either as carbon intensity (kg CO₂e per kg of fruit), which shows how much pollution is generated per unit of product, or as a land-based footprint (kg or tonnes CO₂e per hectare), which shows the burden of managing the orchard area. The studies most often used the ISO 14040 and 14044 LCA standards, ISO 14064 and 14067, the GHG Protocol, the CML 2001 method, and IPCC emission factors, which underpinned every assessment either directly or through the other methods.
Blue, green, and grey water
Unlike carbon, the water footprint does not collapse into one figure. It is split into three components:
- Blue water is surface and groundwater used for irrigation, washing, and processing that does not return to the same source.
- Green water is rainwater held in soil and consumed by the trees through evapotranspiration.
- Grey water is the volume of water needed to dilute pollutants to meet quality standards, which links to eutrophication and freshwater and terrestrial ecotoxicity.
For water, the studies leaned on the AWARE method for water scarcity, the Water Footprint Network methodology for the three components, and FAO's CROPWAT 8.0 for crop water needs, alongside ReCiPe 2016, USEtox, IMPACT 2002+, and PestLCI v2 for pollution and toxicity.
Where avocado carbon emissions come from
Across regions and production systems, three areas account for most of an avocado operation's carbon footprint.
Fertilizer manufacturing and nitrogen
When fertilizer production is counted (a Scope 3 item), the manufacture of mineral fertilizers, especially nitrogen, becomes the single largest contributor, at 50% to 70% of total emissions. The reason is the energy-intensive nature of nitrogen fertilizer manufacturing. This makes nutrient management the area where cutting inputs delivers the biggest reduction in an orchard's footprint, and it ties the carbon question directly to how growers plan avocado fertilizer applications. LCA-based assessments are more accurate when they record the origin and type of fertilizer used, since this is where the largest share of emissions sits.
Energy, irrigation, and transport
Looking at Scope 1 alone, energy for field operations, irrigation pumping, transport between field and packhouse, and packhouse processing makes up the largest direct contribution, at around 20% to 30%. Diesel and electricity for water pumping and cooling feature heavily, particularly in countries with less renewable electricity. In Australia, New Zealand, Peru, and South Africa, electricity for irrigation and groundwater pumping is a leading emission driver, a direct consequence of running large-scale irrigation systems in arid and semi-arid conditions.
Packaging, cooling, and shipping
Cardboard packaging, refrigeration through the supply chain, and marine freight to export markets together account for around 10% of emissions. This share rises sharply for fruit shipped over long distances, and especially for any avocados moved by air, as seen in studies from Australia, Peru, and South Africa. Post-harvest steps that are minor in domestic value chains can become major emission sources once fruit is exported.
Avocado carbon footprint figures by country
Carbon intensity varies widely by region, the processes included, and whether production is organic or conventional. The figures below are drawn from the studies compiled by FAO and are best read as reference points rather than fixed benchmarks, since system boundaries differ between them.
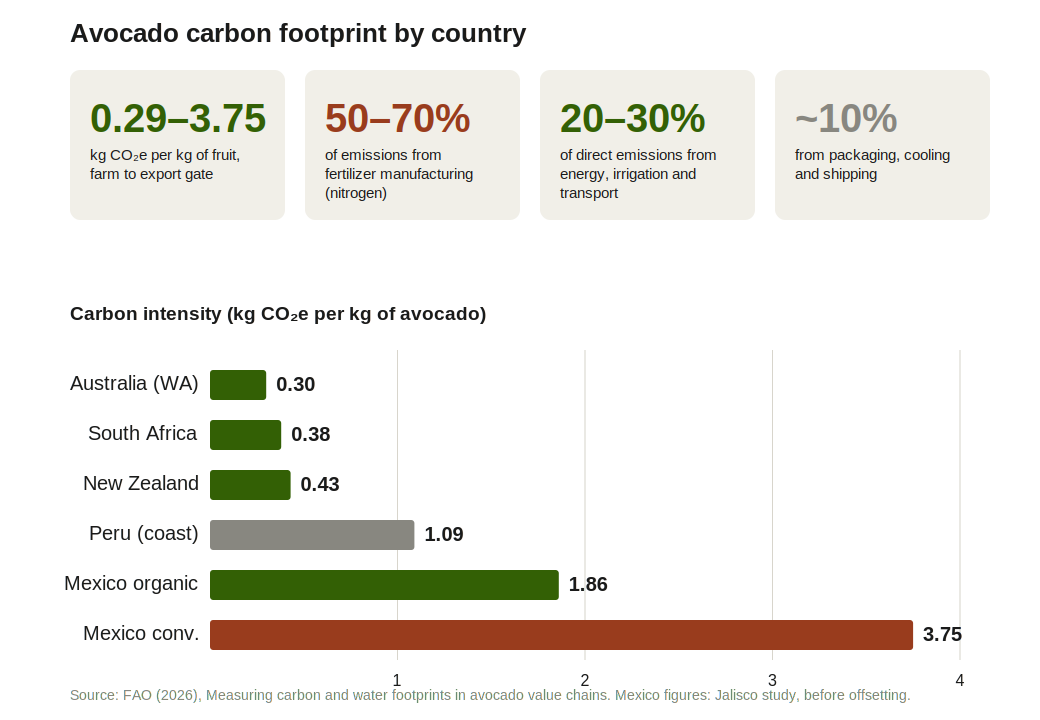
| Country (region) | Carbon intensity (kg CO₂e/kg) | What is included |
|---|---|---|
| Australia (Western Australia) | 0.29–0.32 at production; 0.82 to retail with offsetting | Production; full chain to retail |
| South Africa | 0.38 net, including sequestration | Farm to Europe |
| New Zealand | 0.43 average; 0.743 at peak production | Cradle to orchard gate |
| Peru (coastal) | 1.09 | Production to export port |
| Mexico (Jalisco) | Organic 1.86; conventional 3.75 (1.72 net with offsetting) | Production and packing |
On a land basis, the carbon footprint sits at roughly 3.3 to 3.7 tonnes CO₂e per hectare in the Mexican and Australian studies. The Jalisco comparison is striking. The organic system measured 1.86 kg CO₂e/kg against 3.75 for the conventional one, and fell to a net figure below zero once carbon storage in the trees was counted. Results elsewhere are more mixed, as the next sections explain.
The South African case shows how sequestration shifts the result. A farm-to-Europe assessment recorded about 905 kg CO₂e per tonne before offsets, with roughly 522 kg per tonne offset through sequestration and composting, for a net 383 kg per tonne, or close to 0.38 kg per kilogram.
Where avocado water use and pollution come from
Water impacts fall into two groups, the quantity consumed and the pollution generated.
Irrigation and blue water in dry regions
Consumptive water use is driven overwhelmingly by irrigation. Blue water footprints are highest in arid and hyper-arid areas such as Chile, parts of Mexico, South Africa, California, and the Peruvian coast, where almost all export orchards depend on groundwater or surface water. Water use per kilogram is lower in rainfed systems, or where rainfall meets most of the crop's needs, as in Colombia and some areas of New Zealand and Mexico. Even efficient drip and micro-sprinkler systems still require large groundwater withdrawals in major exporting regions because of the sheer size of the operations. Water use ranges from under 1,000 to more than 20,000 m³ per hectare per year, often averaging 1 to 2 m³ per kilogram of fruit. Water used for washing, processing, and packing is minor next to irrigation, except for processed products such as oil and guacamole, which raise the per-kilogram figure.
Nitrogen, pesticides, and grey water
Water quality impacts trace back to fertilizers and agrochemicals. Nitrogen fertilizers contribute 60% to 80% of eutrophication impacts wherever grey water was measured, mostly through nitrate leaching. Fertilizer and agrochemical production, with pesticide manufacturing as the main contributor, drives water ecotoxicity by 50% to 70%. Climate changes the picture in an unexpected way. In hyper-arid regions such as coastal Peru and Chile, low soil moisture reduces the mobility of pesticides, so a larger share stays on the soil surface rather than leaching into water bodies, which lowers water ecotoxicity. Soil pollution still persists, and most studies count only nitrogen and applied pesticides, which probably understates the true grey water footprint.
Avocado water footprint figures by country
The world average water footprint for avocado, combining green, blue, and grey water, is about 1,086 m³ per tonne, with wide variation by country and region. Because the components measure different things, totals are not always directly comparable.
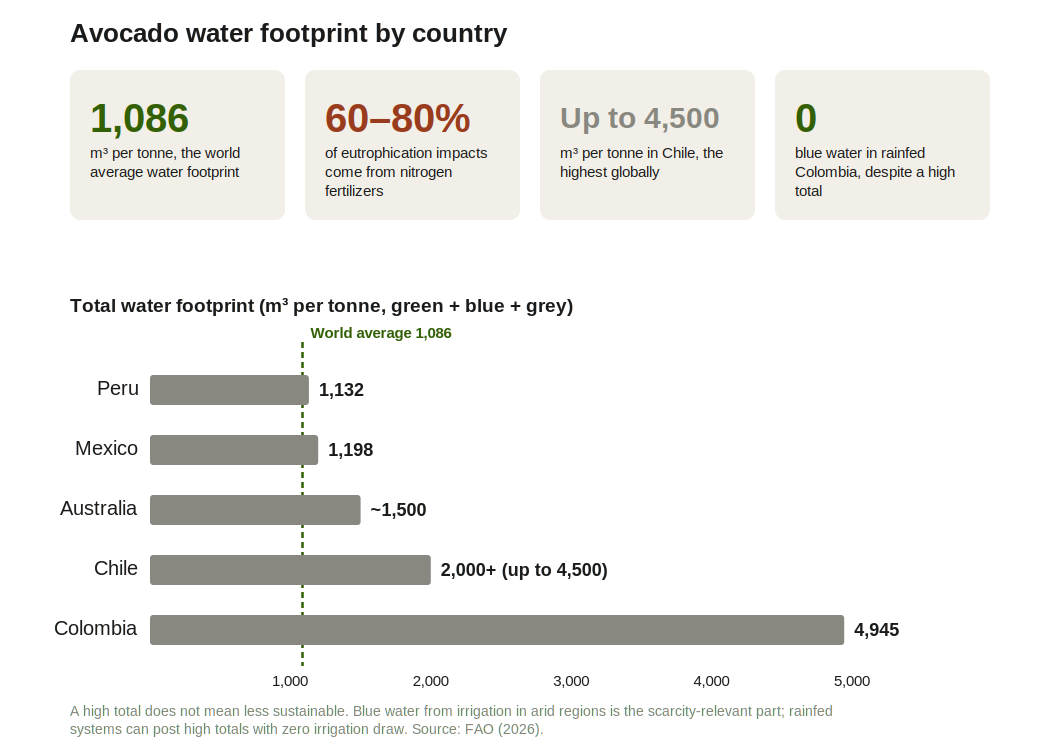
| Country | Water footprint (m³/tonne) | Notes |
|---|---|---|
| New Zealand | Blue 310 | Cradle to orchard gate |
| Peru | Blue + green 1,051; grey 81 | Coastal, hyper-arid |
| Mexico | Blue + green 1,099; grey 99 (range 750–1,600) | One productive year |
| Chile | 1,480–4,500 combining blue and grey (blue + green ~1,800; grey 200+) | Highest globally |
| Australia | Blue + grey 1,000–2,000 | Varies with irrigation and rainfall |
| Colombia | Blue 0; green 359–3,630; grey 1,315; total ~4,945 | Hass, rainfed, two cycles |
Colombia illustrates why the headline total can mislead. Its blue water footprint is zero because production is rainfed, yet its green and grey components push the total above many irrigated origins. The absolute number is only part of the story. What matters for sustainability is local scarcity, competition for water, and groundwater recharge, since the same volume drawn in a water-abundant basin and a stressed one has very different consequences.
How orchard age changes footprint results
Footprint figures move with the orchard's productivity over its life. Emissions per hectare are highest during the peak production years, roughly years 5 to 7, when bearing trees take up the most water and nutrients. Emission intensity per kilogram, by contrast, falls as yields rise, because the same inputs are spread across more fruit. Water and ecotoxicity scores climb with yield and then decline once yields pass about 13,000 to 15,000 kg per hectare. Understanding this curve helps when reading any single figure, since yield per hectare directly shapes the intensity result.
Most published assessments capture only one high-yield year, which can bias the numbers. They tend to leave out the nursery and establishment phase, low-yield early years, and the decline of ageing trees, and they often ignore the alternating heavy and light cropping years that avocado trees show. FAO recommends assessing the full orchard life cycle and benchmarking against a moving average of at least two years, so that infrequent activities such as orchard establishment are represented fairly.
Carbon sequestration and offsetting in orchards
Avocado orchards can store carbon in tree biomass and soil, and some studies and companies count this against gross emissions. In South Africa and New Zealand, sequestration in orchard biomass was treated as an offset that lowers the net footprint per fruit. Good orchard management, particularly pruning and soil practices, supports this storage, and some orchards in established producing countries are over 50 years old, which makes the stored carbon meaningful. The principles overlap with carbon farming and sequestration practices used across other crops.
Industry is already acting on this. A producer association in Colombia runs the Carbono Hass project, which connects growers to carbon markets, and its annual Territorio Aguacate fair became the first of its kind to offset its footprint using credits generated from its own product, covering 105 of the 275.81 tonnes CO₂e it produced in 2023. These efforts feed into the wider field of carbon credits in agriculture. The limitation is method. No standardized, avocado-specific way of quantifying carbon storage yet exists, and the European Commission's criteria credit only sequestration beyond normal orchard activities such as basic soil management and irrigation.
What export buyers and new regulations require
Retailers in importing markets are asking for detailed footprint reporting, with particular focus on blue water used in production. Companies have been requested to disclose the methods and data behind their calculations and to report on set timeframes. Some of these requests create problems of their own. A South African company was asked to report in kilograms per month, a unit that does not reflect the seasonal nature of avocado harvest cycles and that added methodological difficulty.
National frameworks shape how companies respond. Peru's water footprint programme certifies avocado companies as "Blue Companies" when they hit specific water-reduction targets, and in production areas such as Chavimochic, water quotas cap how much each company can use, pushing them toward efficiency. In Colombia, B Corp-aligned certification under Law 1901 of 2018 encourages companies to track and publish their water and carbon footprints in line with buyer expectations. Meeting these requirements affects which markets a producer can sell into, which is why footprint data has moved from a technical exercise to a commercial one. Exporters working to fixed quality and export standards increasingly find environmental disclosure sitting alongside the established maturity and grading checks.
The unfair penalty problem in water footprint reporting
The sharpest tension in the FAO study is over interpretation. A grower in a water-scarce region may invest in highly efficient drip irrigation and precision management and still report a higher water footprint than a grower in a rainfed region who uses no irrigation at all. The higher number reflects the environment, not worse practice. Companies in Chile, Peru, and South Africa raised real concern that disclosing water figures without context could see them labelled unsustainable and placed at a commercial disadvantage.
This is why raw figures need to be read alongside the management practices and the agroclimatic setting behind them. A water footprint is a useful way to flag the pressure a production system may place on a catchment, but judging actual impact requires site-specific data on water quality, availability, and how the operation is run. FAO recommends transparent reporting frameworks and awareness work with retailers, consumers, and policymakers in importing markets, so that footprints are compared fairly rather than ranked on numbers alone.
Practical steps to measure and reduce footprints
For producers and exporters weighing up where to start, the study points to a clear set of actions:
- Measure across the full orchard life cycle, not a single high-yield year, and track both heavy and light cropping years against a multi-year average.
- Target the largest hotspots first. Nitrogen fertilizer and energy for irrigation and transport account for most emissions, so efficient nutrient and water use delivers the biggest reductions.
- Install and use water meters, and analyse the data rather than recording it only when regulation requires.
- Record fertilizer and agrochemical type and origin, since these inputs carry the heaviest carbon and water-quality weight.
- Use available tools such as FAO's EX-ACT for greenhouse gas accounting and WaPOR for monitoring agricultural water productivity, while recognising that none is yet avocado-specific.
- Provide context with every figure. Report management practices and local conditions alongside the numbers to avoid misleading comparisons.
Smaller producers face the steepest barriers here, since data collection alone can take six to eight months and demands capacity that many lack. Most assessments to date have been one-off exercises rather than routine monitoring. Closing that gap will take simpler tools with built-in regional defaults, capacity development for farmers and associations, and shared data platforms modelled on FAO's World Banana Forum.
Frequently asked questions
How much CO₂ does one avocado produce? Roughly 0.058 to 0.75 kg CO₂e per fruit from farm to export gate, depending on the country, the production system, and the steps included. At retail, about four to six avocados make up a kilogram.
Why do Chilean and Peruvian avocados show high water footprints? Both rely on groundwater irrigation in arid and hyper-arid conditions, so their blue water use is high. The large numbers often reflect the dry environment rather than poor water management, which is why context matters when comparing origins.
Does organic avocado farming have a lower carbon footprint? Sometimes. Where organic systems cut agrochemical use, emissions can drop sharply, as in one Jalisco study. But over-applying organic inputs such as manure and compost can raise methane emissions and bring the two systems level, or even reverse the gap.
Can avocado orchards offset their own emissions? In part. Carbon stored in tree biomass and soil, supported by pruning and soil management, can lower the net footprint, and studies in South Africa and New Zealand count it. Standardized, avocado-specific methods for measuring that storage are still missing.
References
- Hernández Lagana, M. (2026). Measuring carbon and water footprints in avocado value chains. Rome, FAO.
- Esteve-Llorens, X., Ita-Nagy, D., Parodi, E., González-García, S., Moreira, M. T., Feijoo, G. & Vázquez-Rowe, I. (2022). Environmental footprint of critical agro-export products in the Peruvian hyper-arid coast: A case study for green asparagus and avocado. Science of the Total Environment, 818, 151686.
- Blaauw, S. A., Broekman, A., Maina, J., Steyn, W. & Haddad, W. A. (2024). Life Cycle Assessment of an Avocado: Grown in South Africa – Enjoyed in Europe. Environmental Management, 74(5), 989–1005.
- Majumdar, S. & McLaren, S. (2024). Towards use of life cycle-based indicators to support continuous improvement in the environmental performance of avocado orchards in New Zealand. The International Journal of Life Cycle Assessment, 29, 192–217.
- Astier, M., Merlín-Uribe, Y., Villamil-Echeverri, L., Garciarreal, A., Gavito, M. & Masera, O. (2014). Energy balance and greenhouse gas emissions in organic and conventional avocado orchards in Mexico. Ecological Indicators, 43, 281–287.


")
