
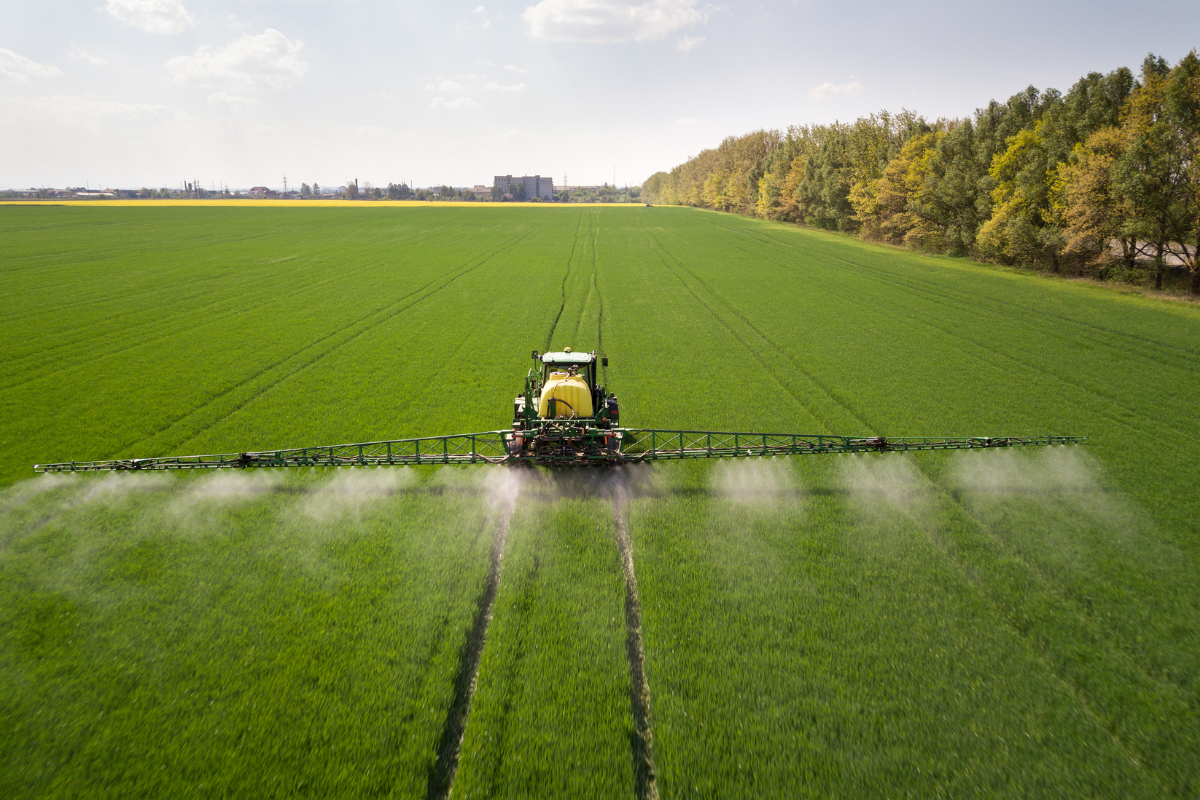
Two of the indicators that track farming practice most directly, pesticide use per hectare of cropland and agricultural water withdrawal, are trending in the wrong direction globally. The finding comes from the Food Systems Countdown Report 2026, the assessment of 44 food system indicators across 197 countries led by Johns Hopkins University, Cornell University, FAO and the Global Alliance for Improved Nutrition. Most coverage of the report has focused on hunger and diets. Its production and environment scorecard deserves the same attention, because it measures the choices made in fields, orchards and barns.
What the report actually measures on the farm
The assessment's environment and production theme tracks the variables an agronomist would recognise from a farm audit. Yields by food group, covering beef, cereals, fruit, milk and vegetables, measure how much each hectare or animal produces. Nitrogen use efficiency measures how much of the applied nitrogen ends up in the crop rather than in the water and air. Pesticide use is tracked as kilograms of active ingredient per hectare of cropland. Agricultural water withdrawal is measured against the renewable water resources actually available. Cropland area change captures whether farming is expanding into natural habitat, a major driver of biodiversity loss and emissions. Greenhouse gas intensity is tracked per kilogram of product for beef, cereals, milk, and rice, and two further indicators assess whether farmland retains sufficient natural habitat and species diversity to sustain the ecosystem functions that crops depend on.
Together, these indicators answer a practical question. Setting aside what the world eats, is the way food is grown becoming more efficient and less damaging, or the reverse?
The two farm indicators are going backwards
The answer is mixed, and the two clearest reversals sit squarely on the input side. Pesticide use per hectare is rising globally even as the goal calls for it to fall, and agricultural water withdrawals are climbing as a share of renewable resources. Both belong to the small group of indicators the report identifies as actively regressing, alongside ultra-processed food sales and two governance measures.
The two reversals share a logic. Both reflect intensification pursued through higher inputs rather than higher efficiency. More pesticide per hectare and more water drawn per unit of renewable supply both point to production growth that leans on the volume of inputs, and both carry costs that arrive later, in resistant pests, polluted water, depleted aquifers and degraded soil. The direction matters more than the level because an input curve that is still rising has not yet reached the turn toward efficiency that high-income agriculture underwent decades ago.
Efficiency is where the progress lives
The indicators built around efficiency tell a better story. Yield growth has been the main engine of production increases for years, which is why cropland expansion, though still a concern in specific regions, has stayed slower than output growth. Nitrogen use efficiency is the measure that matters most here, because nitrogen is both the most yield-defining input and one of the most damaging when wasted. Improving it means more crop per kilogram of fertiliser, less nitrous oxide in the air, and less nitrate in the water, a rare case where the economic and environmental interests point in the same direction.
Emissions intensity completes the efficiency picture. Emissions per kilogram of beef, cereal, milk and rice are falling in most regions as yields and animal productivity improve, even as agriculture's total emissions keep rising with herd and fertiliser growth. That tension, falling intensity against a rising total, is the same one running through the OECD-FAO projections on farm emissions to 2035, and the Countdown assessment confirms it from the monitoring side. Food systems emissions remain the indicator with no country on track, requiring annual cuts beyond 30% even on a 2050 timeline.
Efficiency tools already exist for pesticides and water
A global scorecard becomes useful when it changes what happens on an actual farm, and the farm-level translation of these findings is specific. The regressing indicators, pesticides and water, are precisely the ones where efficiency tools already exist. Integrated pest management reduces kilograms of active ingredient per hectare without surrendering control of the pest. On the water side, moving from volume to precision, through soil moisture monitoring, deficit strategies and efficient delivery, cuts withdrawal without cutting yield, the approach covered in our guide to optimising irrigation efficiency.
The improving indicators point in the same direction as the other side. Yield growth and nitrogen use efficiency reward exactly the practices, from soil testing and split applications to precision placement, that reduce the input curve the regressing indicators track. The scorecard's farming section repeats the same instruction five times. Produce more from each unit of land, water, nitrogen and chemistry, because the era of growth through more inputs is the era the wrong-direction arrows describe.
Sources
- Nordhagen, S., Beal, T., Carducci, B. and Mclaren, R. (2026). The Food Systems Countdown Report 2026: Assessing Performance, Driving Change. Johns Hopkins University, Cornell University, FAO and GAIN.
- Carducci, B. et al. (2026). Food systems performance evaluated against targets and benchmarks reveals urgent gaps and a path to 2050. Nature Food.