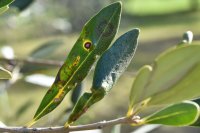


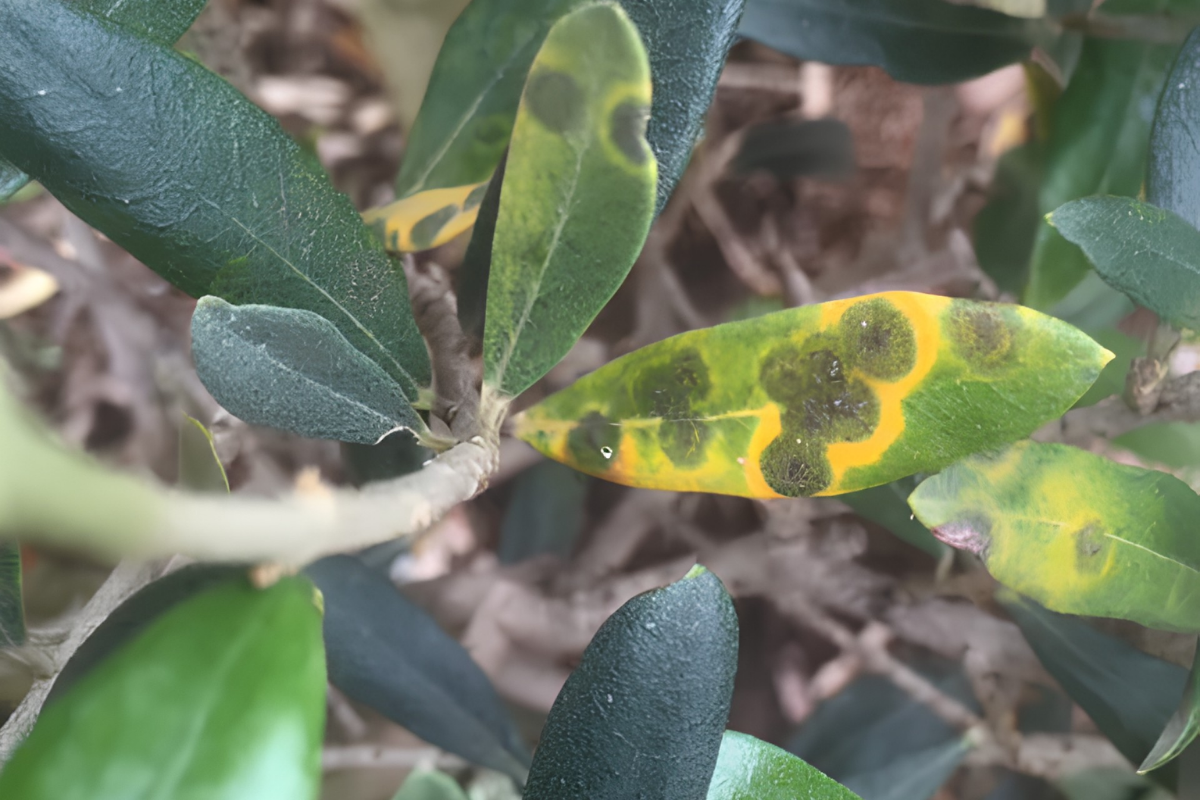
Plant protection bulletins for olive, circulating this season across western Greece and the Ionian islands, no longer confine themselves to general guidance. They publish daily risk curves for olive leaf spot, drawing on weather stations in locations such as Velika in Messinia and Kalyvia in Aetolia-Acarnania, where temperature, relative humidity and rainfall are translated into a percentage risk figure.
Behind those curves sit models with specific parameters, and understanding them lets a grower see why one rainfall event is dangerous, and another is not.
What an infection requires
Infection by the fungus Venturia oleaginea requires two things at once, and the absence of either cancels it.
It requires continuous leaf wetness, meaning free water on the leaf surface so that conidia can germinate, and at the same time, temperature within a specific range, because outside that range germination stops regardless of moisture. Conidia are carried exclusively by water, through rain splash and run-off from leaf to leaf, so a damp mist without rain does not move inoculum the same way.
The numbers that define the risk
Work on Greek isolates of the fungus pinned down both thresholds. Conidial germination occurs between 5 and 25°C, with the optimum at 20°C. Above and below that range, the process does not proceed, which explains why summer heat effectively halts disease development.
Germination requires at least 12 hours of continuous leaf wetness at the optimum temperature. That figure is the minimum threshold for initiation. Field guidance often uses longer intervals as a safety margin, since the full establishment of infection and the development of disease take more time than the simple germination of a conidium, and the longer the wetness period lasts, the more severe the resulting infection.
Leaf age changes susceptibility
A third factor, absent from the curves yet decisive for the outcome, is tissue age. Studies show a negative correlation between leaf age and disease severity, with very young leaves proving extremely susceptible. The same rainfall, at the same temperature and for the same wetness duration, therefore causes far greater damage to a tree carrying fresh growth than to one with mature foliage. This is also why spring forms the second critical period of the year, combining wet weather with tender tissue.
The trial in Chalkidiki
Two forecasting models, one generic and one polynomial, were tested under field conditions at Potidea in Chalkidiki over three consecutive years, from 2016 to 2018, monitoring temperature, rainfall and leaf wetness from May through December.
The results came in two parts. Both models correctly predicted infection periods, meaning when the event occurred. They differed, however, in predicting the severity of infection, meaning how much damage followed.
That distinction carries practical weight. A model answers whether an infection period occurred and when, so it serves to determine the timing of treatment. It does not replace inspection of the grove, which shows how serious the situation has become.
Latency makes forecasting essential
The value of forecasting is greater for olive leaf spot than for most other diseases because of its latent period. Weeks pass between infection and the appearance of the first lesions, and under conditions unfavourable to the fungus, that interval exceeds one hundred and twenty days. A grove that looks clean may already be infected, and by the time symptoms show, the moment for effective treatment has gone.
Management is therefore preventive, and prevention requires knowing when the risk is coming. That is precisely what the models and the bulletin curves provide.
Where the inoculum overwinters
The fungus passes the summer as mycelium inside infected leaves, both those remaining in the canopy and those fallen to the ground. In autumn, the mycelium resumes activity, either from latent infections formed the previous spring or from old lesions, and produces new conidia that disperse by rain splash to start the new cycle. This is why the first autumn rains mark the onset of secondary infections, as the bulletins note.
Putting it to work
A model does not replace planning, it sharpens it. The autumn spray remains preventive and goes on ahead of the rains. The risk curve shows which rainfall events will turn into genuine infection periods, so that the spray precedes the ones that matter and is not repeated needlessly where conditions never come together.
When combined with bulletins issued by regional plant protection centres, which publish area-level curves, a grower can compare their own site with the nearest station and adjust accordingly.
Notes
The temperature and wetness values quoted come from experimental studies under controlled conditions, and from validation at one specific site, so they serve as a framework for understanding rather than a prescription. Risk curves apply to the measuring station and need to be adjusted for the microclimate of each grove. Timing and choice of treatment are set by local plant protection bulletins, in consultation with an agronomist, using only approved plant protection products in line with label directions.
Sources
- Thomidis, T. et al. Evaluation of Two Predictive Models for Forecasting Olive Leaf Spot in Northern Greece. Plants.
- Viruega, J. R. & Trapero, A. Effect of temperature, wetness duration and leaf age on infection and development of olive leaf spot. Acta Horticulturae.
- Viruega, J. R., Roca, L. F., Moral, J. & Trapero, A. Factors affecting infection and disease development on olive leaves inoculated with Fusicladium oleagineum. Plant Disease.
- Roubal, C. et al. Field models for the prediction of leaf infection and latent period of Fusicladium oleagineum on olive. Plant Pathology.
- Obanor, F. O. et al. Effects of temperature, inoculum concentration, leaf age, and continuous and interrupted wetness on infection of olive plants by Spilocaea oleagina. Plant Pathology.