


In the 14 oil price spikes from 1960 to 2021, the months when the Brent price came to stand 50% above its level a year earlier after at least a year without such a rise, the urea price was higher six months later in 10 of the 14, while for palm oil, soybean oil and maize the share was close to half, about the same as in any six-month period, according to a Wikifarmer analysis of World Bank monthly commodity prices. In October 2026 Brent averaged $125.0 a barrel, 93.2% more than in October 2025, while in the spike that began in April 2026 the urea price fell 51.0% within six months, more than after any earlier spike.
Brent averaged $125.0 a barrel in October 2026
The monthly average Brent price reached $125.0 a barrel in October 2026, 93.2% higher than in October 2025 and above every monthly average since July 2008, when it was $133.9 (World Bank). In March 2012 the price had reached $124.9, just $0.1 below this year's level. The current spike began in April 2026, when Brent cost $120.4 a barrel, 77.8% more than in April 2025.
Six months after a spike the urea price was higher in 10 of 14 cases
Before the 2026 spike, the World Bank series records 14 spikes in the Brent price, from October 1973 to March 2021. Six months after the spike month the urea price was higher in 10, with a median rise of 21.0% over six months, while across all six-month periods since 1961 the urea price was higher at the end in 43.4% of cases. The world sugar price was higher six months after the spike in 9 of the 14, with a median rise of 8.3%, against 46.6% across all six-month periods. Sugar also has its own history: defining a surge as a rise of 30% within seven months, after 18 surges in the sugar price itself since 1960 the price was higher six months later in 13.
A year after the spike the urea price was again higher in 10 of the 14, with a median rise of 38.2%, and the sugar price in 8, with a median rise of 21.0%, while across all 12-month periods since 1961 the price was higher in 49.7% of cases for urea and 48.8% for sugar. Six months after the October 1973 spike the urea price was 4.4 times as high, but for those years the series gives one price per year, so the change is the jump from the 1973 price to the 1974 price. Without that spike, the urea price was higher in 9 of the 13 spikes at both six months and one year.
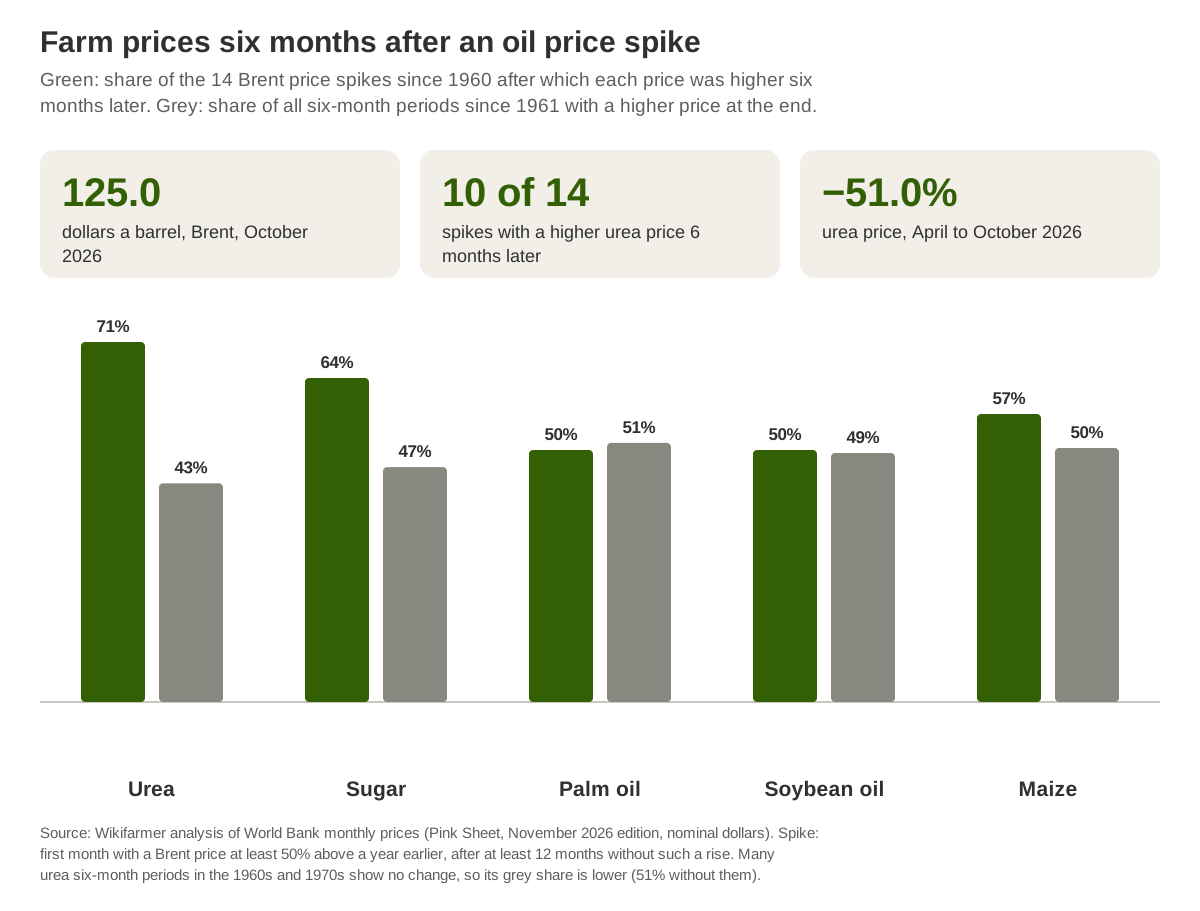
Source: Wikifarmer analysis of World Bank monthly prices (Pink Sheet, November 2026 edition). A spike is the first month with a Brent price at least 50% higher than a year earlier, after at least 12 months without such a rise.
For vegetable oils and grains the share was close to half
Six months after the 14 spikes the palm oil price was higher in 7, with a median change of a 0.8% fall, the soybean oil price also in 7, with a median fall of 1.1%, and the maize price in 8, with a median rise of 1.2%. Across all six-month periods since 1961 the price was higher in 51.4% of cases for palm oil, 49.4% for soybean oil and 50.4% for maize, so after an oil spike these three prices rose about as often as they do in any six-month period. The same holds for US HRW wheat and for soybeans, which were higher six months later after 7 of the 14 spikes.
A year after the spike the palm oil price was higher in 6 of the 14, the soybean oil price in 7 and the maize price in 6, while across all 12-month periods since 1961 these prices were higher in 51.9%, 49.2% and 52.1% of cases. The largest six-month rise in palm oil, 41.1%, followed the October 1973 spike, and the largest fall, 21.5%, the May 2018 spike.
| Episode month | Brent ($/barrel) | Brent rise over 12 months | Urea, 6 months later | Sugar, 6 months later | Palm oil, 6 months later |
| October 1973 | 4.1 | +115.8% | +341.0% | +128.6% | +41.1% |
| February 1979 | 22.0 | +73.2% | +11.9% | +11.1% | -6.1% |
| June 1987 | 18.9 | +58.8% | +5.7% | +28.6% | +26.3% |
| October 1989 | 19.0 | +52.0% | +53.1% | +6.2% | -16.8% |
| October 1996 | 24.2 | +50.3% | -21.6% | 0.0% | +5.6% |
| July 1999 | 19.0 | +58.3% | +23.2% | 0.0% | +9.1% |
| December 2002 | 28.5 | +53.2% | +34.7% | -16.7% | -4.7% |
| September 2004 | 43.4 | +60.1% | -0.5% | +17.6% | -2.1% |
| November 2007 | 92.5 | +58.1% | +73.0% | +22.7% | +32.7% |
| December 2009 | 74.7 | +79.6% | -13.6% | -32.7% | +0.5% |
| May 2011 | 114.5 | +50.1% | +105.7% | +10.4% | -9.5% |
| January 2017 | 54.9 | +78.2% | -22.6% | -28.9% | -12.7% |
| May 2018 | 76.7 | +50.7% | +37.7% | +3.7% | -21.5% |
| March 2021 | 65.2 | +97.6% | +18.7% | +26.5% | +14.7% |
| April 2026 | 120.4 | +77.8% | -51.0% | from $0.32 to $0.43 per kg | -5.2% |
Source: Wikifarmer analysis of World Bank monthly prices (Pink Sheet, November 2026 edition), in US dollars, not adjusted for inflation. An episode month is the first month in which the Brent price was at least 50% higher than a year earlier, after at least 12 months without such a rise. Changes are measured from the price of the episode month. For the 2026 episode the changes run to October 2026. The sugar price is published to two decimal places, so changes of zero are approximate.
In the 2026 spike the urea price fell 51.0% within six months
From April to October 2026 the urea price fell from $856.9 to $420.0 a tonne, a fall of 51.0%, the largest six-month fall after any Brent spike since 1960, the largest until then having been 22.6% after the January 2017 spike. Over the same period the sugar price rose from $0.32 to $0.43 a kilo, and because the World Bank publishes the price to two decimal places, the rise lies somewhere between 31% and 38%. The palm oil price fell 5.2% and the soybean oil price 5.9%, while the maize price rose 5.8%. The main feedstock of urea is natural gas, and the ratio of the urea price to the natural gas price fell in October to its lowest level since December 2022.
A spike is the first month Brent is 50% above a year earlier
The World Bank series for Brent is the monthly average price in US dollars a barrel from January 1960, and in its early years it equals the World Bank's average crude oil price. A spike is the first month in which the price was at least 50% higher than in the same month a year earlier, provided that in the previous 12 months the rise against a year earlier was below 50%, so that the same rise is not counted several times. With a 40% threshold the urea price was higher six months later after 11 of 14 spikes, while with a 75% threshold the spikes fall to 9 and the urea price was higher in 6, as often as the US HRW wheat price, and the soybean price in only 2, so the result depends on the threshold chosen.
Seven commodities were examined over two horizons, 14 comparisons in all. In the 1960s the urea price is almost always unchanged from month to month, and from 1970 to 1976 one price is published for each year, so 14.9% of six-month periods show no change at all and the 43.4% share is lower than it would be with full monthly data. Leaving out the periods with no change, the urea price was higher in 51.0% of six-month periods, and the chance of it being higher after 10 or more of the 14 spikes by luck alone is about 10%. The link between urea and oil in these data is therefore a weak indication, and for sugar, at 9 of 14 against 46.6%, the difference from an ordinary six-month period is smaller still. The urea price is the Middle East free-on-board price from March 2022 and the Black Sea price before that, the sugar price is the International Sugar Agreement (ISA) raw sugar price, palm oil is Malaysian and maize is US Gulf. Changes are simple percentage changes from the spike month, in dollars of each period and not adjusted for inflation, and the 2026 spike is left out of the counts because its 12 months are not complete.
The comparison matters to buyers of fertiliser and farm products
In the data since 1960, after a Brent spike the urea price was higher six months later in 10 of the 14 cases and the sugar price in 9, while the prices of palm oil, soybean oil, maize, wheat and soybeans were higher in about half, as in any six-month period. The prices farmers pay in each country also depend on the currency, tariffs and transport costs.
The sample is small, and so far the current spike has run against the historical pattern for urea. In the coming months, the World Bank's monthly prices for November and December will show whether Brent stays near October's $125.0 and how the urea price moves from $420.0 a tonne. The World Bank's monthly prices may be revised. The figures describe what prices did in the past and are not a forecast.
Sources
- World Bank. (2026). Commodity Markets, Pink Sheet monthly prices. World Bank Group.