")

There are roughly 582 million agricultural holdings worldwide, spread across 2.9 billion hectares (7.2 billion acres) of farmland across the 131 countries studied. The average holding is about 5 hectares (12.4 acres), but that figure hides a deep imbalance. The 2026 FAO, ILC, and CIRAD report The Status of Land Tenure and Governance, drawing on data from 131 countries, lays out just how skewed the picture is.
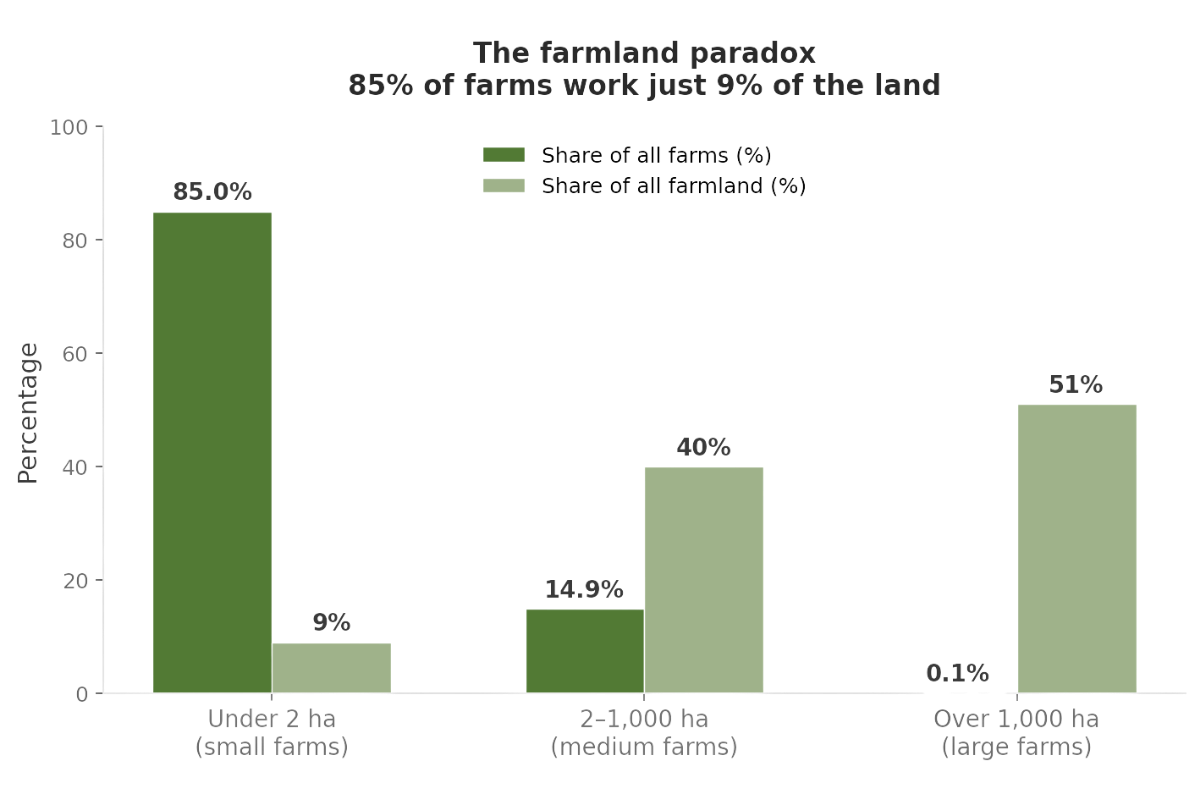
Farms larger than 1,000 hectares (2,471 acres) represent just 0.1% of all holdings on the planet, yet they operate more than half the world's farmland. At the other end, nearly 500 million farms sit below 2 hectares (4.9 acres). These small farms make up 85% of all agricultural units but work only about 9% of the total land.
How farmland is split across regions
The global figures become clearer when broken down by region.
In Eastern and South-eastern Asia, the average holding is just 0.8 hectares (2 acres). Southern Asia follows at 1.1 hectares (2.7 acres), and sub-Saharan Africa averages 2.3 hectares (5.7 acres). In all three regions, farming evolved around dense populations working relatively small plots, often under subsistence agriculture systems where most of the harvest goes directly to feeding the household.
Then the scale shifts dramatically. Europe and Central Asia average 18.9 hectares (46.7 acres). Latin America and the Caribbean reach 45.6 hectares (112.7 acres). North America stands at 200.2 hectares (494.9 acres). And Oceania, driven by the vast cattle and sheep stations of Australia and New Zealand, averages 1,756.5 hectares (4,340.8 acres). In these regions, commercial agriculture dominates, and land has been consolidated into larger operations over decades of mechanization, policy, and market pressure.
The top 10% hold most of the land
The size of a farm tells only part of the story. What matters more is how much total farmland the largest operations control, because that determines how income, resources, and political influence get distributed.
On average across countries, the top 10% of landholders operate about 56% of farmland. That alone is a steep concentration. But the report also calculated an aggregate figure, combining all landholders across countries rather than averaging each country equally. Under that lens, the top 10% control roughly 89% of the world's farmland. The smallest 40% of landholders, by contrast, work about 6% of land on average and just over 1% in aggregate.
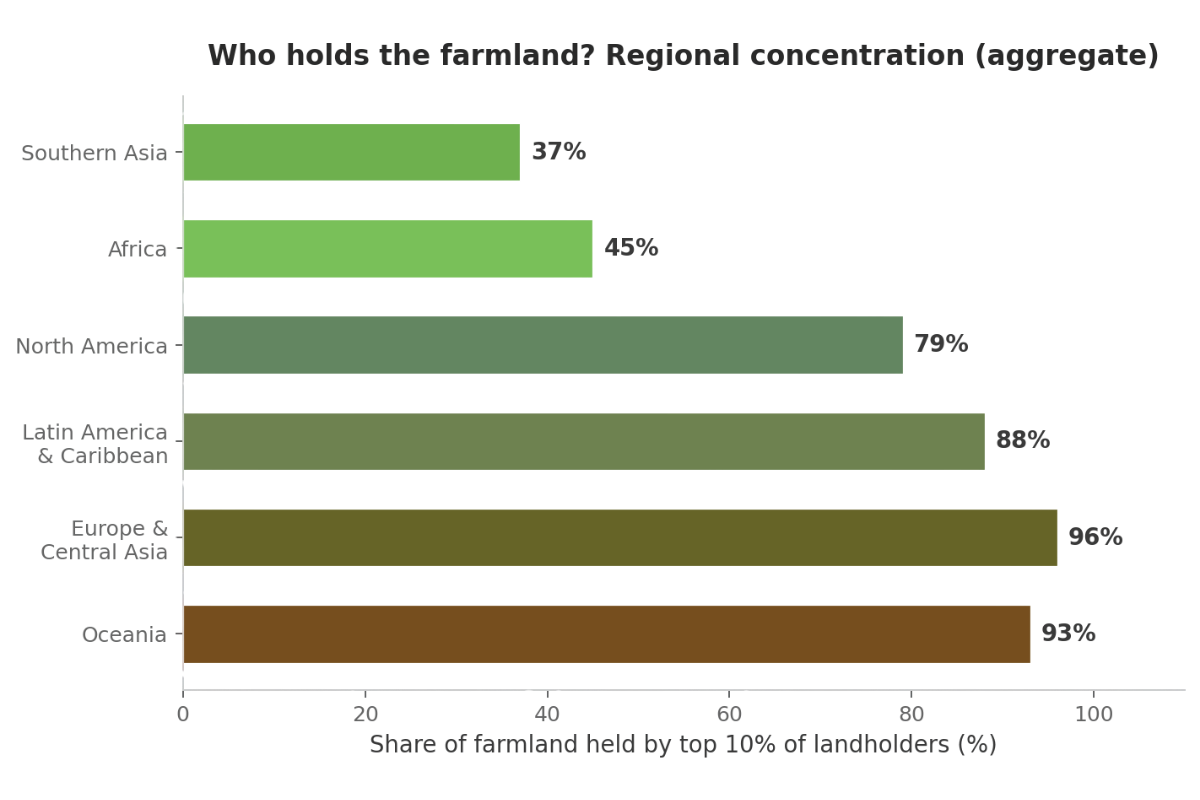
Regional differences in concentration are striking. In Oceania, Europe, and Latin America, the top 10% of landholders control between 88% and 96% of farmland in aggregate. These are regions where historical colonization patterns, large-scale ranching, and corporate farming have concentrated ownership over generations. North America follows at 79%.
Southern Asia is the most equal region. The top 10% hold 37% of farmland in aggregate, and the smallest 40% manage around 10%, reflecting long histories of land reform and persistent smallholder systems. Africa shows similar patterns overall, with the notable exception of South Africa, where apartheid-era land policies created a concentration that persists today.
Documentation makes the gap worse
All the figures above are based on total land operated, regardless of whether a farmer has any legal documentation proving their right to that land. When the report narrowed the analysis to include only documented or legally alienable land rights, inequality increased in every country studied.
The starkest examples come from sub-Saharan Africa. In Mali, Niger, and Guinea-Bissau, the top 10% of landholders control all documented land. The bottom 40% hold none. The same pattern shows up in Benin, Côte d'Ivoire, Senegal, and Togo. This does not mean smallholders in these countries have zero access to land. Many farm plots held through customary or informal arrangements. But without a legal document, they have no formal protection against displacement, no collateral for loans, and no standing in government land registries.
In Latin America, the top 10%'s share also increases substantially when only documented land is counted. Countries like Cambodia and Myanmar, by contrast, show minimal differences, suggesting that in parts of Asia land access is more evenly distributed regardless of formal tenure status.
The pattern confirms what many family farmers already know from experience: operating land and having a legal claim to it are two very different things. That gap matters when government support programs, subsidies, or credit instruments require proof of ownership.
What is pushing land into fewer hands
Two forces are accelerating concentration. The first is large-scale land acquisitions. Since 2000, foreign and major domestic investors have acquired at least 26.7 million hectares of farmland globally, according to Land Matrix data cited in the report, a figure that more recent assessments place even higher, near 30-33 million hectares. Africa accounts for 42% of those deals, totaling about 10 million hectares (24.7 million acres) at an average deal size of 29,000 hectares (71,660 acres). Many of these acquisitions target land previously considered marginal but now attractive due to rising food prices and interest in carbon storage.
The second force is the growing role of financial actors. Corporate entities and financial firms now drive about 70% of large-scale land transactions tracked globally. Pension funds alone make up 51% of the investors in this category. Most of these actors (73%) operate through shareholding structures rather than direct ownership, which makes it increasingly difficult for governments and monitoring organizations to track how much land any single entity actually controls.
Why this matters for working farmers
Equitable land access is one of the documented drivers of poverty reduction and food security. The report notes that countries with more equal land distribution have historically experienced stronger economic development, while those that failed to carry out effective redistribution tend to show persistent rural poverty and slow structural change.
For over 400 million farms under 2 hectares, the trends outlined above are not abstract. They shape whether a farmer can get a bank loan, qualify for government programs, or invest in sustainable practices that require long-term security on the land. Whether through strengthened market access for small-scale producers, cooperative ownership models, tenure reform, or regulations on corporate land accumulation, the responses need to match what the data is showing. And the data is showing a global food system where the land itself is increasingly out of reach for the people who do most of the farming.
References
FAO, ILC and CIRAD. 2026. The status of land tenure and governance. Rome and Paris.
Lowder, S., Aslihan, A., Cabrera-Cevallos, C.E., O'Neill, M., & de la O Campos, A.P. (2025). Farms, farm size, and farmland distribution: An update with most recent data and improved methodology. ESA Working Paper. Rome, FAO.


