

Plant protection bulletins issue codling moth (Cydia pomonella) treatment dates with striking precision, often several days before anything visible happens in the orchard. This is not experience-based guesswork. Behind every one of those dates sits a heat accumulation model, and a grower who understands how it works can anticipate rather than follow.
Why does temperature govern the cycle
Codling moth, like all insects, is poikilothermic. It does not regulate its own body temperature, so its rate of development tracks the ambient temperature. Below a certain threshold, development stops. Above it, development accelerates as the thermometer rises.
That relationship gives us degree days. Instead of counting calendar days, we accumulate the heat the insect has received above its developmental threshold. A warm ten-day spell accumulates more degree days than a cool one, and the insect advances accordingly.
It also explains why the same calendar dates do not carry over from one year to the next or across elevations. The orchard does not run on days. It runs on heat.
The model was validated in Greek orchards.
A degree-day model, developed and validated for temperate Mediterranean conditions, used 16 datasets from apple orchards in Greece between 2011 and 2014.
The model uses a lower threshold of 10.1°C and starts accumulating on 1 January. It described the phenology of all three male flights with high accuracy, returning coefficients of determination above 0.9 in every case.
| Stage | Accumulated degree days from 1 January |
| First males, overwintering generation | 250 to 300 |
| First flight peak | 468 |
| First males, second flight | 850 to 900 |
| Second flight peak | 1130 |
Why does the accumulation starts on 1 January
International practice usually starts accumulation from a biological reference point, the biofix, meaning the date when sustained adult catches are first recorded in pheromone traps. The Greek model starts from a calendar date instead, and there is a reason for that.
Work in Washington State apple orchards compared the two approaches and found that model performance was similar across generations, regardless of whether a biofix was used or heat units were accumulated from 1 January. Dropping the biofix simplifies management and removes errors caused by poor trap catch, particularly in low-pressure situations where mating disruption reduces trap efficiency.
Put plainly, the calendar start delivers the same accuracy without depending on whether a trap happened to catch moths during the right week.
From flight to egg hatch
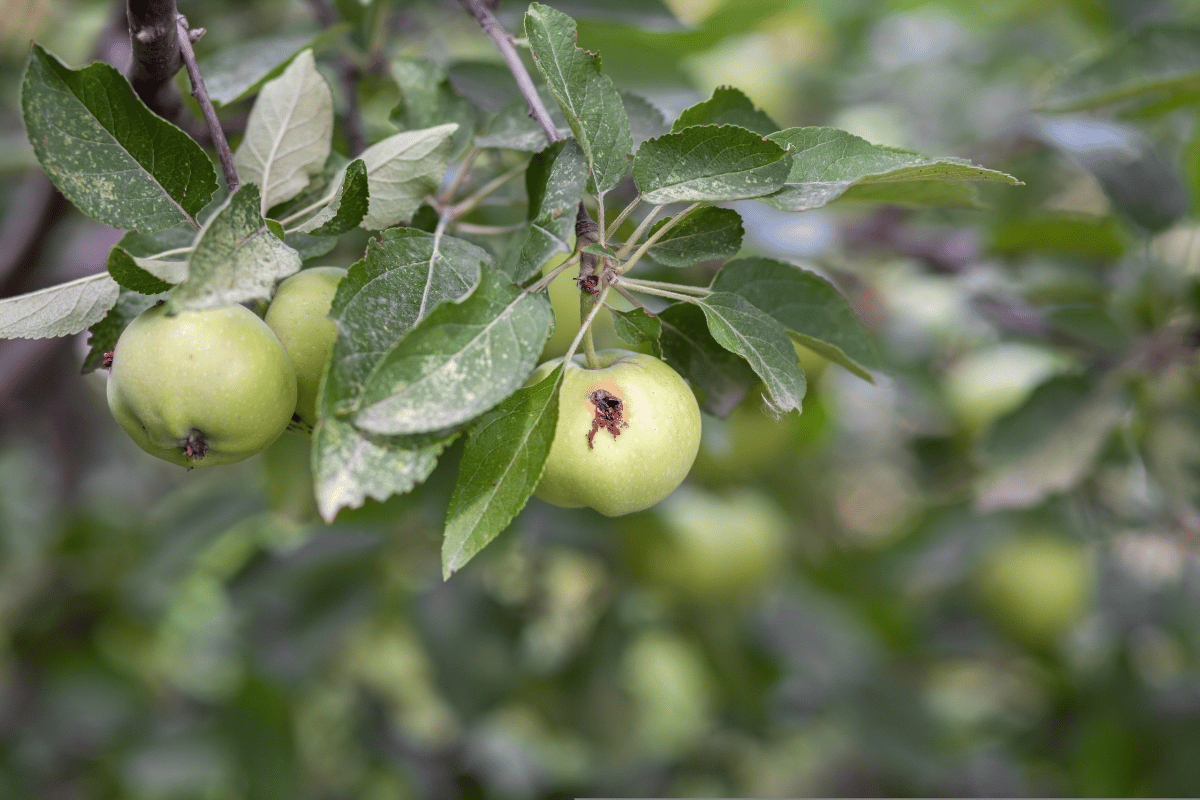
The point most often missed is that adult flight is not the target. Adults cause no damage. The newly hatched larva causes damage during the brief interval between leaving the egg and entering the fruit.
Once inside, the larva sits protected within the flesh, and no contact product reaches it. The window is narrow, and the model exists precisely to locate it.
The catch curve indicates when eggs are laid and, therefore, when larvae will hatch. It is not a measure of damage. An orchard can show moderate catches and serious infestation, or the reverse, which is why trap monitoring is always paired with sampling the fruit itself.
How many generations
Depending on the season's temperatures and the region, codling moth completes two to four generations per growing season. Greek conditions typically produce three flights.
Elevation shifts the whole schedule. A mountain orchard accumulates degree days more slowly, so it reaches the same stages later in the season and often completes fewer generations. This is why bulletins are issued separately for lowland and upland zones.
What makes the third generation different
The third generation is not simply another repeat. Three features change how it is managed.
Fruit is close to harvest, so pre-harvest intervals narrow the window and restrict the choice to products with short residual activity.
Treatments have already been applied for the first two generations within the same season. The surviving population has been selected, and resistance becomes a real risk if successive sprays share the same mode of action.
The flight often appears prolonged and irregular rather than showing a clean peak, because it overlaps with the tail of the previous generation. A single week of low catches does not mean it is over.
Tools beyond spraying
Mating disruption using pheromones is the most widely adopted management method in major apple-growing regions internationally. It works by saturating the air with a synthetic pheromone, preventing males from locating females. It carries one consequence growers need to plan for, since it also reduces the effectiveness of monitoring traps, which puts more weight on fruit inspection.
Codling moth granulovirus, known as CpGV, is a biological product highly specific to this insect, leaving natural control of other pests and resident pollinators undisturbed. Its mode of action dictates how it is applied. It acts as a larvicide and must coat the eggs so that the larva ingests a lethal dose upon emergence.
Residual activity is short, especially under hot summer conditions. It is applied in the evening and repeated every five to seven days. Research has shown that more frequent applications at a low rate outperform less frequent applications at a high rate while also costing less.
Parasitoids such as Mastrus ridens are used in integrated programmes. In Greece, macroorganism-based products are selected from the relevant national catalogue maintained by the Ministry of Rural Development and Food.
Putting it to work
The model does not replace walking the orchard, but it delivers two things observation alone cannot.
It provides a warning, allowing treatment to be scheduled before larvae appear rather than after the first damage is found. And it explains the differences between seasons and between locations that would otherwise seem random.
Before any treatment, the same three questions apply. When was the last application, which active ingredient was used, and how long does its coverage last? The model shows when the window opens. Residual activity shows whether it is already covered.
Notes
The degree-day values quoted come from a model calibrated for specific regions and seasons, and serve as a framework for understanding rather than a prescription for any individual orchard. Elevation, microclimate, variety and infestation history all shift the schedule. Treatment decisions should be based on local plant protection bulletins, your own trap data, and fruit inspection, in consultation with an agronomist. You can use only approved plant protection products, following label directions.
Sources
- Damos, P. & Savopoulou-Soultani, M. A degree-day phenological model for Cydia pomonella and its validation in a Mediterranean climate.
- Jones, V. P. et al. Is biofix necessary for predicting codling moth emergence in Washington State apple orchards?. Journal of Economic Entomology.
- UC Statewide IPM Program. Codling Moth, Apple, Pest Management Guidelines.
- Michigan State University Extension. Early-season organic codling moth management.