

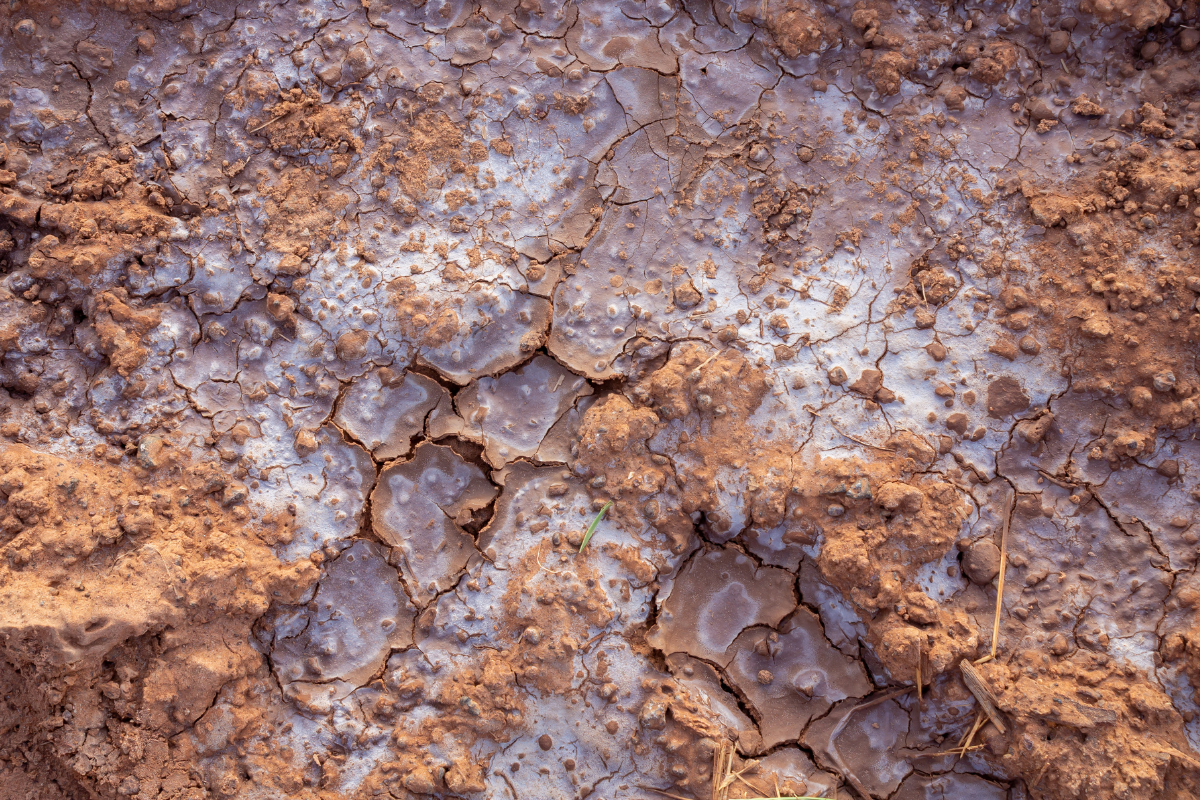
Salt-affected soils cover 1,381 million hectares, or 10.7% of the world's land surface, with a further 1,038 million hectares carrying enough salt to be at risk. The figures, compiled in the Status of the World's Soil Resources 2026, describe a problem that arrives quietly, because a field does not look damaged until yields have already fallen.
Salinity concentrates where evaporation exceeds rainfall, which puts the Mediterranean, the Near East and Central Asia at the centre of the map. The area with the highest proportion of salt-affected soil runs from the Arabian Peninsula through the Zagros Mountains and the Central Iranian Plateau to the Indo-Gangetic Plain, extending north across the Turan Plain and the Kazakh Plateau.
The difference between saline and sodic soil changes the fix
Salt-affected soil comes in three forms, and the distinction determines the remedy. Saline soil has an electrical conductivity above 4 dS/m in the saturated paste extract and an exchangeable sodium percentage below 15, indicating it contains too much soluble salt. A sodic soil has an exchangeable sodium percentage above 15 and a conductivity below 4, meaning sodium dominates the exchange sites even when total salt is low. A saline-sodic soil has both.
The consequences differ. Salinity limits the plant's ability to take up water, producing drought symptoms in a wet soil. Sodicity attacks the structure, since a high proportion of sodium relative to calcium and magnesium disperses clay particles, which collapse aggregates, seal the surface, and destroy infiltration. Leaching helps a saline soil and makes a sodic one worse without a calcium source such as gypsum to displace the sodium first.
Depth matters too. In the top 30 cm of affected soils, 85% are saline, 10% are sodic, and 5% are saline-sodic. Between 30 and 100 cm the balance shifts, with 62% saline, 24% sodic and 14% saline-sodic. A surface test can therefore miss a sodic subsoil that limits rooting depth.
Irrigation is the main way salt gets into farmland
Poorly managed irrigation is identified as the major global source of human-induced salt accumulation. Three mechanisms do the damage, namely irrigation without adequate drainage that lets salty groundwater rise into the root zone, the use of salty water for irrigation, and the application of too little water to leach salts below the roots.
The scale is uncertain and the uncertainty is itself a finding. Older FAO work estimated 34 million hectares, around 11% of the irrigated area, affected by some level of salinity, with a further 60 to 80 million hectares affected by waterlogging and related salt accumulation. More recent reviews put secondary salinisation between 45 and 80 million hectares, equivalent to 20% to 30% of all irrigated land, with about half of it in China, India, Pakistan and the United States. The report carefully notes that the evidence behind these numbers is dated and often unclear.
Coastal farming faces a second route. Sea level rise, storm surges and the over-pumping of coastal aquifers all push saline water inland, and where that water is then used for irrigation, the salt goes straight onto the field. For Greek and other Mediterranean coastal areas, where summer irrigation demand peaks exactly when aquifer levels are lowest, this is the mechanism that matters most.
A third route operates without irrigation at all. Clearing deep-rooted perennial vegetation reduces evapotranspiration, which lets the water table rise until saline groundwater reaches the root zone. This dryland salinity is best documented in Australia's Murray-Darling Basin, where vegetation clearance, water extraction and river regulation combined to salinise land across the catchment.
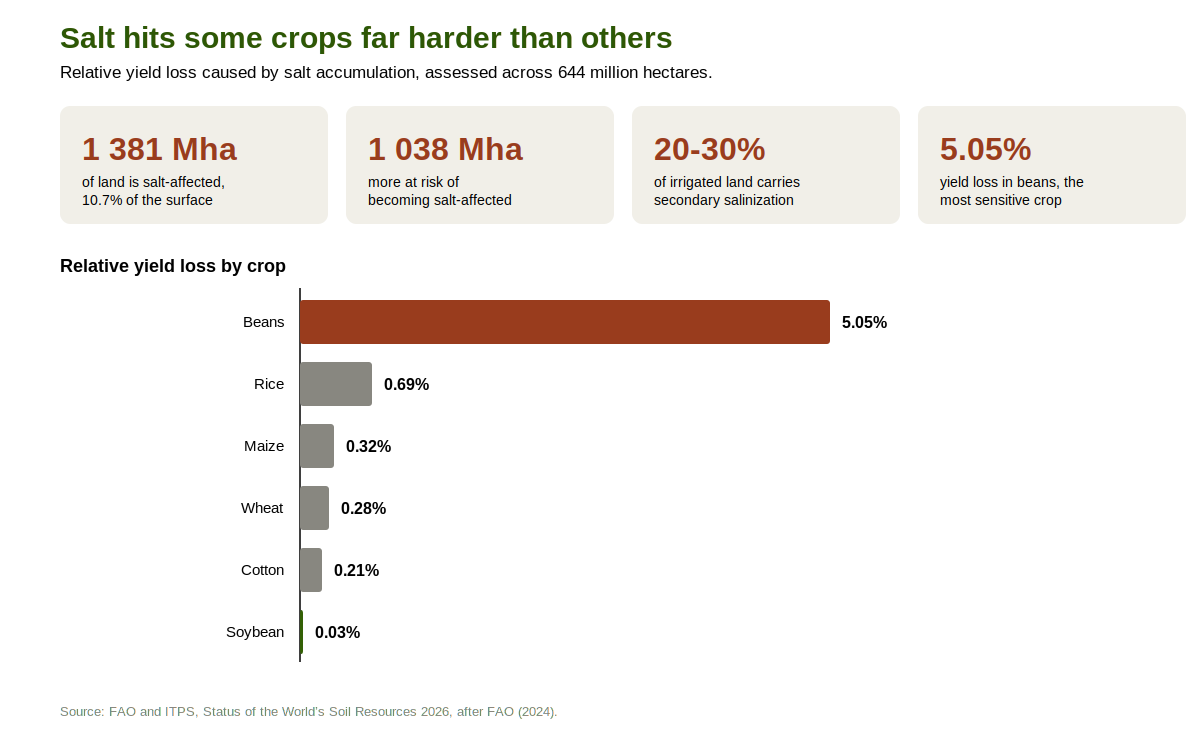
Beans lose 5.05% of yield to salt accumulation while soybean loses 0.03%, a spread of more than 150 times between the most and least sensitive crops assessed.
The yield losses look small until you find the sensitive crops
Across 644 million hectares assessed for yield impact, the total relative yield loss from salt accumulation came to 0.5% on average. That average is misleading in both directions, because tolerance varies enormously between crops.
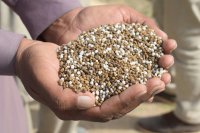
Soybean lost 0.03% and cotton 0.21%. Wheat lost 0.28%, maize 0.32% and rice 0.69%. Beans lost 5.05%, more than a hundred and fifty times the soybean figure. The pattern reflects known differences in salt tolerance, and it translates directly into a planting decision, since the same field that barely troubles a barley or cotton crop can make beans and other sensitive legumes uneconomic.
The averages also hide severity. A national or global mean spreads a severe local problem across a large unaffected area, which is why farm-level electrical conductivity testing tells a grower more than any regional figure.
Most of what is known about soil salinity is forty years old
The report returns repeatedly to a data problem. Most global information on soil salinity dates back to the 1980s, and while modelling has advanced, calibration still rests largely on that historic data. Estimates of irrigation-induced salinization in wide circulation come from work published in 1991 and 1995.
That gap has consequences beyond academic tidiness. Without current data, no one can say reliably whether salinity is advancing or retreating in a given district, which makes it impossible to evaluate whether drainage investment or irrigation scheduling changes are working. The recommendation is for improved global mapping and satellite monitoring capable of tracking spatial and temporal change, which would put salinity on the same observational footing as other forms of degradation.
For growers, the practical response does not wait for better maps. Testing water and soil conductivity before problems appear, maintaining drainage so salts can move below the root zone, applying enough water to leach rather than the minimum to survive, choosing tolerant species where salinity is established, and using gypsum where sodicity rather than salinity is the issue all address the mechanisms directly. The relationship between irrigation practice and soil condition runs through the wider question of how irrigation efficiency is managed, since the same decisions that waste water often concentrate salt.
Sources
- FAO and ITPS. (2026). Status of the world's soil resources 2026. Rome, FAO.