Optimising an installation is rarely about one feature. Energy consumption is usually the factor under pressure, but it has to be reduced while the crop still gets the climate it needs, so what is really being optimised is the method rather than any single number. This is why comparing LED and high-pressure sodium on lamp efficacy alone gives an incomplete answer. How efficiently a fixture converts electricity into photons is only part of the question. The useful part is what happens to the whole greenhouse when one technology replaces the other.
To look at that, I used GreenLight, the open-source greenhouse model developed by Katzin and colleagues at Wageningen, to compare three lighting installations under identical weather, climate set-points, crop conditions and delivered light.
An HPS lamp also heats the crop
A specification gives you efficacy: how many photosynthetic photons leave the fixture per joule of electricity. A practical question is how much electricity each one draws to deliver a specific light intensity. For 200 µmol/m²/s from toplighting:
- HPS at 1.8 µmol/J needs about 111 W/m².
- LED from 2.95 to 3.9 µmol/J needs around 67 to 51 W/m².
Moving from an HPS to an LED fixture therefore removes roughly 44 W/m² of energy input.
It is clear that HPS consumes more energy and has lower lighting efficiency. However, it also emits a substantial share of its input as near-infrared radiation, acting as a hot body radiating toward the crop. Part of that 44 W/m² arrives directly at the leaf as radiant heat, which usually must be compensated for by the heating system to meet temperature targets. Growers have learned to use this: lamp radiation warms the plant head and surrounding air, lifting the microclimate, driving higher growth rates, and keeping the crop transpiring. LED emits far less near-infrared, transferring more waste heat to the air around the fixture instead. So the switch does three things at once. It reduces lighting electricity, it transfers a larger share of the heating requirement to the heating system, and it changes the thermal conditions the crop experiences.
Total energy use fell 17% while lighting electricity fell 39%
To put numbers on that rather than arguments, I ran a HPS vs LED simulation through GreenLight under one set of conditions. The setup is summarised below: same weather, same greenhouse, same climate control, with the lamp as the only difference between runs.
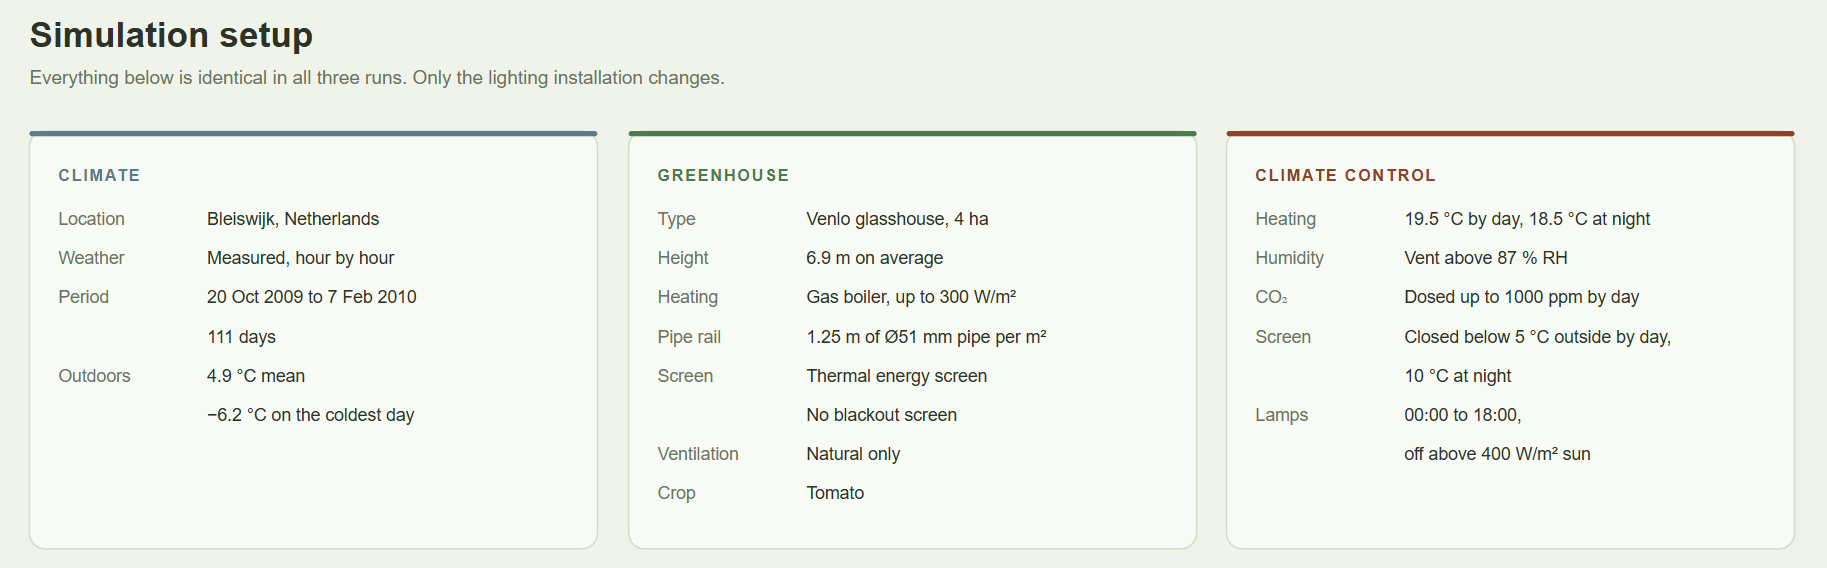
Simulation setup, identical in all three runs except for the lighting installation. Source: GreenLight simulation by the author.
With an 18-hour photoperiod, moving from HPS to the 2.97 µmol/J LED:
- Reduced lighting electricity by 39% (from 221 to 135 kWh/m²)
- Boiler heat rose 48% (from 77 to 114 kWh/m²)
- Total energy use fell 17%
- Modelled yield fell 2.3%
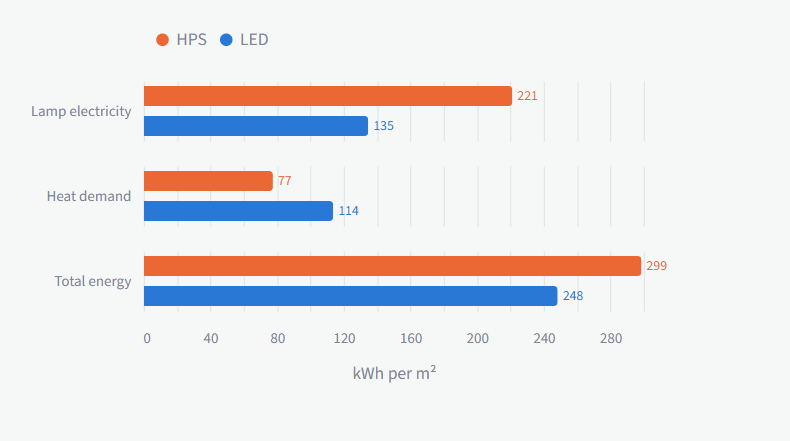
Lamp electricity, heat demand and total energy over the season under HPS and LED, in kWh per m². Source: GreenLight simulation by the author.
The installation saved 86 kWh/m² of lighting electricity, but the greenhouse needed another 37 kWh/m² of boiler heat, so about 43% of the saving came back as heating demand. That is what a calculation based on the lighting meter alone misses. These are energy units, not money. In most greenhouses the energy supply is a combination of a boiler, a CHP and a heat buffer, so the electricity and the heat in this comparison are not independent purchases that can simply be traded against each other.
The crop responds to how the heat arrives
Energy figures describe what the greenhouse consumes. They do not describe the conditions the plant experiences.
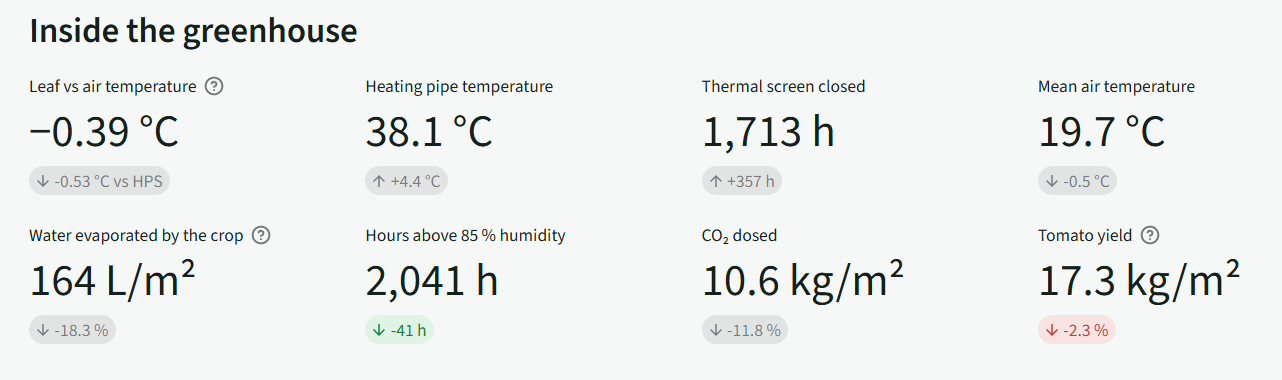
Modelled conditions inside the greenhouse under LED, with the change against HPS. Source: GreenLight simulation by the author.
- Under HPS, modelled canopy temperature averaged 0.14 °C above air temperature.
- Under LED it averaged 0.39 °C below air temperature.
Radiant heat from HPS keeps leaves warmer than the surrounding air; without it the crop can sit cooler than the air even while the heating system works harder. A leaf absorbs radiation, exchanges longwave heat with its surroundings, transfers sensible heat to the air, and uses energy to evaporate water. That last route is transpiration, and it connects the leaf's energy balance to the plant's water relations. A cooler leaf also has a lower saturation vapour pressure, which narrows the vapour pressure difference driving water loss even at unchanged air humidity. Heating pipes warm the air and the air warms the leaf, but that route is not equivalent to radiation absorbed at the leaf surface.
In this simulation, transpiration fell 18.3%.
That matters because transpiration also carries water and nutrients through the plant, besides cooling the leaf. Calcium moves with the water stream towards growing tissue and is not readily redistributed once deposited, so where delivery cannot keep pace with a rapidly expanding organ, that organ becomes vulnerable to calcium-related disorders such as blossom-end rot or tip-burn.
Lower transpiration also changes the humidity balance, though not in the direction intuition suggests. Absolute humidity describes how much water vapour the air holds; relative humidity describes how close it is to saturation at its current temperature. Under LED the crop releases less moisture, but cooler air saturates at a lower vapour content, so relative humidity can rise even as absolute humidity falls. That is why steering on relative humidity alone will mislead in both directions at once.
The control strategy changes to match. In the modelled season the heating pipes ran 4.4 K hotter under the 2.97 µmol/J LED and 9.3 K hotter under the 3.9 µmol/J fixture, and the thermal screen stayed closed for 357 additional hours. So the installation was not the only thing that changed: pipe temperature and screen position changed with it, and that is where part of the additional boiler heat goes. The macroclimate may look familiar on the panel. The microclimate at the leaf is not.
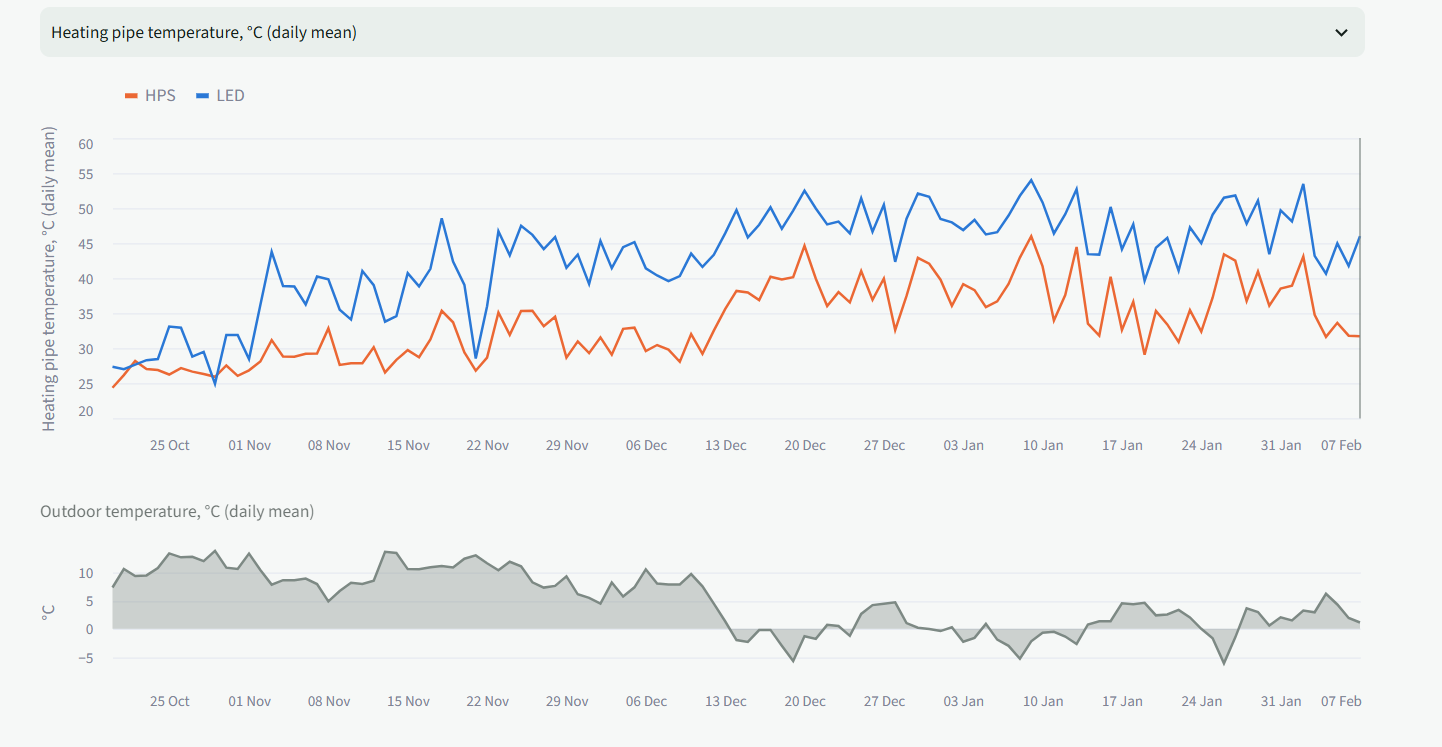
Daily mean heating pipe temperature under HPS and LED, with outdoor temperature below. Source: GreenLight simulation by the author.
Modelled yield fell 2.3% under LED for equal light summation through the days. These are modelled outcomes rather than measured losses, and the model does not establish a mechanism. What the result does show is that equal light delivery does not guarantee equal crop outcomes, because the lamp changes the environment the crop responds to. Treat the crop response as something to monitor rather than something the fixture specification settles in advance, watching canopy temperature against air temperature, transpiration and water uptake, humidity through the canopy, and crop development over time.
Growers with CHP cannot read the saving straight from the model
For a grower buying electricity from the grid and heat from a gas boiler, the calculation can start from the two prices. Much of Dutch horticulture, particularly among growers who light, does not work that way. A greenhouse with combined heat and power generates electricity from gas while supplying useful heat and flue-gas CO₂ to the crop, exports to the grid when the market justifies it, and may store heat in a buffer for later. Electricity and heat are then dependent purchases of one system whose relative value changes hour by hour.
That is why the exchange in this simulation does not convert directly into a saving for such a grower. Under LED the greenhouse needs less electricity for lighting and more heat from elsewhere, and under CHP those two are produced together: less lighting demand can mean fewer engine hours, which means less heat and less flue-gas CO₂ arriving with them, at exactly the point in the season when heat demand has gone up.
GreenLight does not simulate any of this. What it can do is estimate how a lighting change shifts the greenhouse's heat requirement and climate, and that output is the input to a separate analysis of the grower's own energy system.
The saving from LED is real but smaller than the lamp suggests
The case for LED is real, and smaller than the lamp specification suggests. At equal light this installation used about 17% less total energy while the lighting meter showed 39%, so a payback built on lamp electricity alone overstates the saving.
What comes with it is a different climate at the crop. The canopy runs cooler than the air instead of warmer, transpiration falls, pipes run hotter, screens stay closed longer, and relative humidity no longer means what it did.
So treat the choice as a balance question rather than a fixture question. Taking that electricity out of the lamps shifts the heating requirement onto the pipes, and shifts the plant's energy balance too, because that energy no longer reaches the leaf as radiation. Less energy at the leaf also means less evaporation, so the moisture balance moves with it. Minimum pipe temperature and pipe position are worth revisiting with the head of the plant in mind, not only the air.
Then verify, because the setpoints will not tell you. On the climate side, measure leaf temperature against air temperature and read moisture as absolute humidity and humidity deficit. On the crop side, keep the weekly measurements going: head thickness against stem extension, flowering speed, water uptake. Read those as ratios tracked over time rather than as single numbers, and watch development speed in particular, because a cooler crop is a slower crop. A head thinning while the stem keeps extending is the crop reporting on the energy balance it is living in, and it reports weeks before the harvest figures do.
The lamp was never only a lamp. It was a light source, a source of radiant heat and a driver of transpiration at the same time, and replacing it changes all three.
How the simulation was set up
Results are from GreenLight, the open-source greenhouse model of Katzin et al. (2020), using the lamp parameter sets published in Katzin et al. (2021). Three installations were simulated in the same 4 ha Venlo-type glasshouse under the same measured Bleiswijk weather, 20 October to 7 February, each delivering 200 µmol m⁻² s⁻¹ from toplighting: double-ended HPS at 1.8 µmol/J, LED at 2.97 µmol/J and LED at 3.9 µmol/J. Climate set-points were identical across runs.
These are modelled outcomes rather than measurements from a commercial conversion. GreenLight resolves the greenhouse energy balance and a simplified tomato crop. It does not resolve canopy light distribution or spectral quality, so it cannot support conclusions about interlighting or spectrum, and its energy system represents a boiler rather than CHP, with no electricity sales, flue-gas CO₂ or heat buffers.
Sources
- Katzin, D., Marcelis, L.F.M., & van Mourik, S. (2021). Energy savings in greenhouses by transition from high-pressure sodium to LED lighting. Applied Energy, 281, 116019.
- Katzin, D., van Mourik, S., Kempkes, F., & van Henten, E.J. (2020). GreenLight: An open source model for greenhouses with supplemental lighting. Evaluation of heat requirements under LED and HPS lamps. Biosystems Engineering, 194, 61-81.
- Kusuma, P., Pattison, P.M., & Bugbee, B. (2020). From physics to fixtures to food: current and potential LED efficacy. Horticulture Research, 7, 56.
- Monteith, J.L., & Unsworth, M.H. (2013). Principles of Environmental Physics (4th ed.). Academic Press.
- van Beveren, P.J.M., Bontsema, J., van Straten, G., & van Henten, E.J. (2019). Optimal utilization of a boiler, combined heat and power installation, and heat buffers in horticultural greenhouses. Computers and Electronics in Agriculture, 162, 1035-1048.