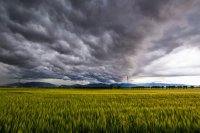

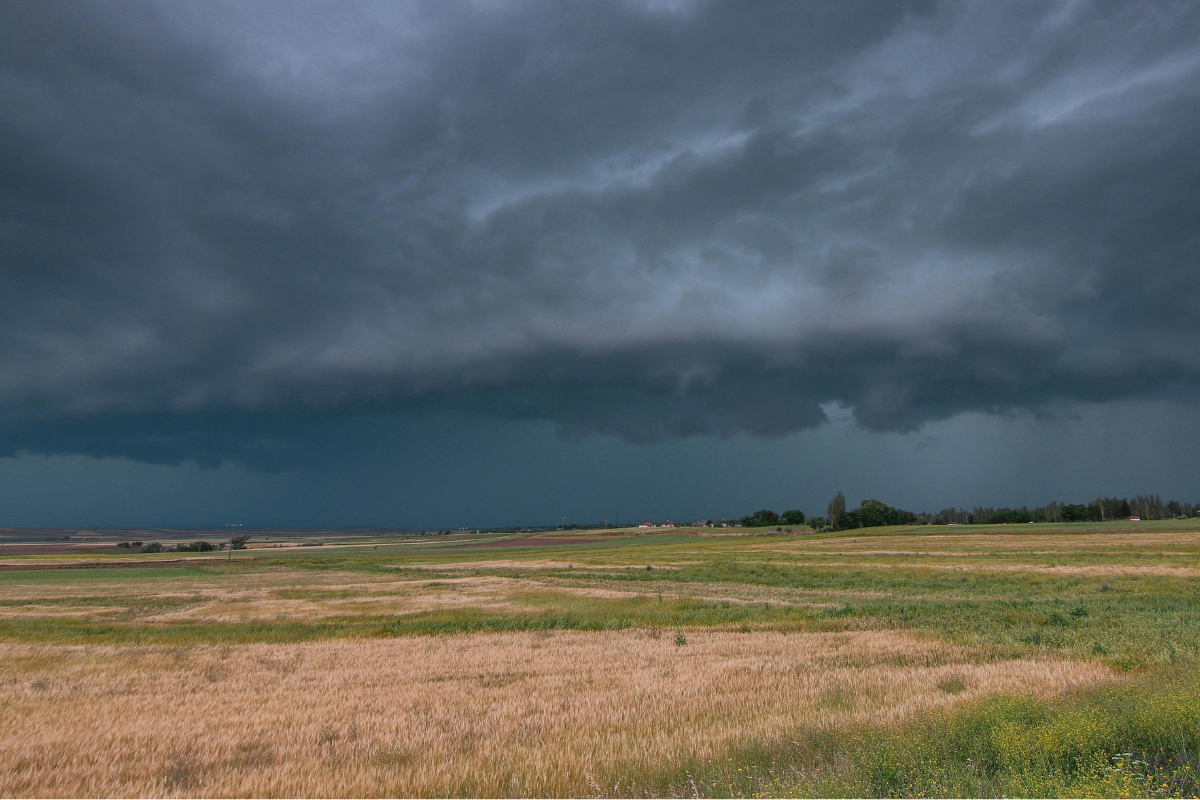
Long before anyone could check a forecast on a screen, farmers were reading the weather from what they could see around them. In many rural and indigenous communities, they still do, and in mountainous country, where conditions change sharply over short distances, that local reading often matters more than a regional forecast.
I went to Sololá, Guatemala, to find out how well it actually works. Over 60 days, 27 farmers across five communities recorded their own daily forecasts based on the signs they normally use, and gave their views on the different sources of weather information available to them. Their forecasts were then measured against the rain gauges' readings and a commercial weather app that did the same job.

The study area in the department of Sololá, with the five communities, weather stations and rain gauges.
Nature as the original weather app
The daily surveys produced 1,364 observations, from which 40 distinct indicators emerged, combining flora, fauna, atmospheric conditions and celestial events. The most frequently used, each recorded more than 100 times, were patterned clouds, grey clouds, cloud cover, birds, and wind speed and direction.
The same indicator does not always mean the same thing. Ants gathering food intensively signal heavy rain, while ants dispersed and wandering signal little. Birds staying in the nest point to rain, birds leaving it to feed point to none. The signal carries the meaning, not the animal alone, and animal behaviour generally turned out to be among the more reliable ways of anticipating rain.\
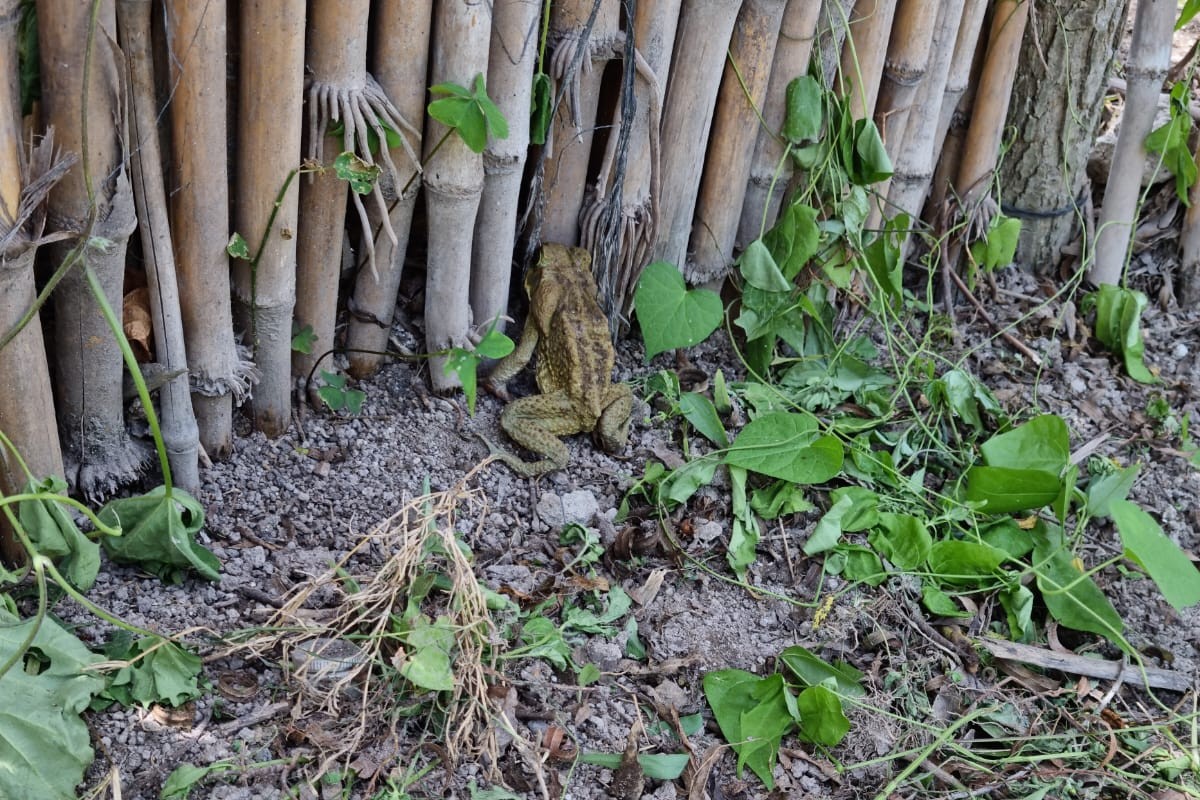
Frogs and toads moving away from the water and becoming highly active is read as a sign of rain.
Most of the indicators surfaced in ordinary conversation rather than in the formal survey, so the questionnaire was designed to let farmers describe a sign in as much detail as they wished. Evaristo Chocoy, a professional birdwatcher in Sololá, provided further details on how birds signal approaching rain.
To place all this in context, the indicators farmers described were compared against the literature on Mayan weather knowledge. Petrich and García (2001) collected sayings and short spells from Mayan culture in the department of Sololá, written in several Mayan languages and translated into Spanish. Cat-Colli (2015) documents Mayan use of cloud patterns, animals, and the sun for daily predictions, and records the Xocomíl, a local phenomenon in which pressure and temperature differences between the lake and the surrounding mountains produce rain accompanied by strong winds.
Do the indicators actually work?
Throughout the observation period, forecasts from Meteoblue were recorded alongside the farmers' own predictions, noting whether rain was expected and, where given, how much. Both were then compared against rainfall measured by local rain gauges and by INSIVUMEH, Guatemala's national meteorological institute, which gave a common reference for judging which came closer to what actually fell.
The test applied was demanding. A forecast is counted as correct only when rain fell on the day predicted and fell within the predicted amount band, those bands being little at 1 to 5 mm, some at 5 to 10 mm, moderate at 10 to 20 mm, and heavy above 20 mm, with anything under 1 mm treated as no rain. Getting the day right while missing the quantity is counted as a failure. Skill was then scored using the Hanssen-Kuipers discriminant, a standard measure of how well a forecast separates days with rain from days without.
Against that standard, across all five communities, the weather app correctly detected rainfall events around 25% of the time. The farmers' indicators managed 22%.
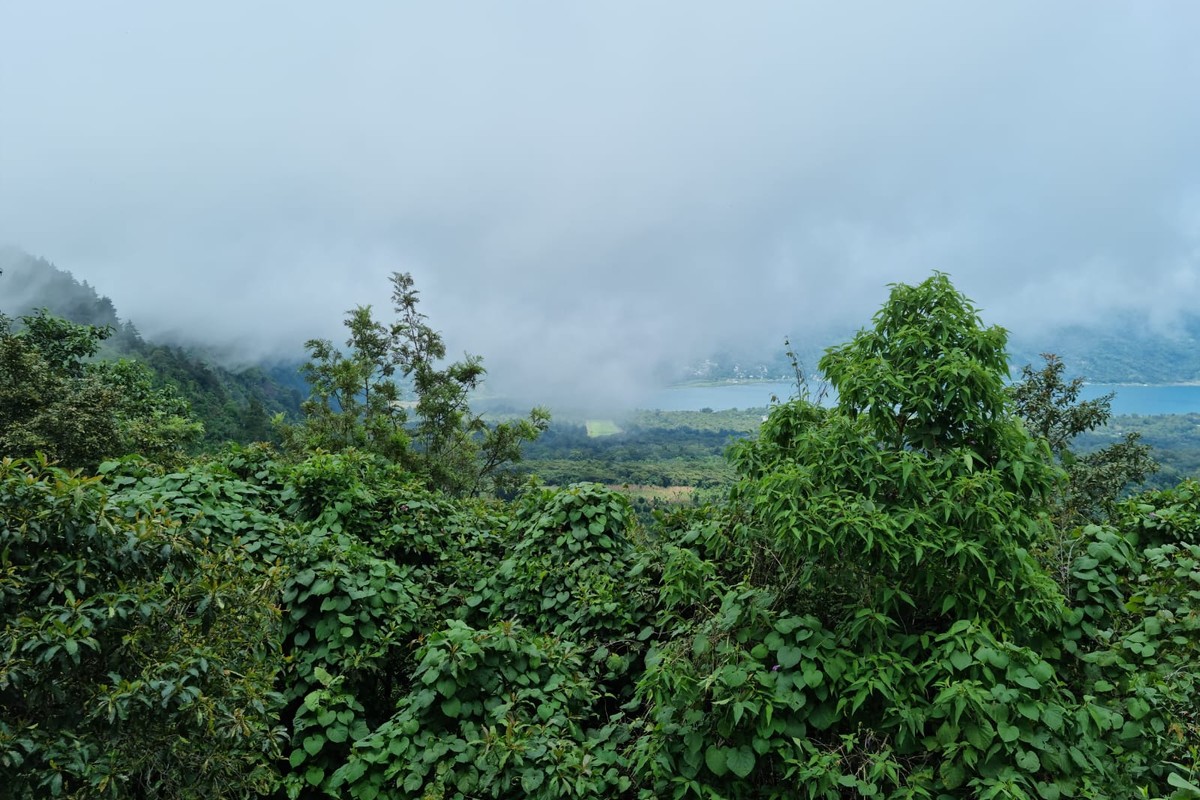
Fog settles around the mountains and hills, which farmers read as a strong sign of rain.
Neither figure is high, which is what a strict day-and-quantity test produces in mountainous terrain where rainfall varies over short distances. What matters is the gap between them, and it is small enough that observation based on local signs performs about as well as a commercial app in this landscape.
Within that 22%, some indicators did considerably better than others. Patterned clouds reached 37%, sun 35%, wind 29%, birds 24%, and a halo around the sun 20%. Performance also varied by place. The weather services did better in San Marcos, while local indicators did better in Yathza and Sololá.
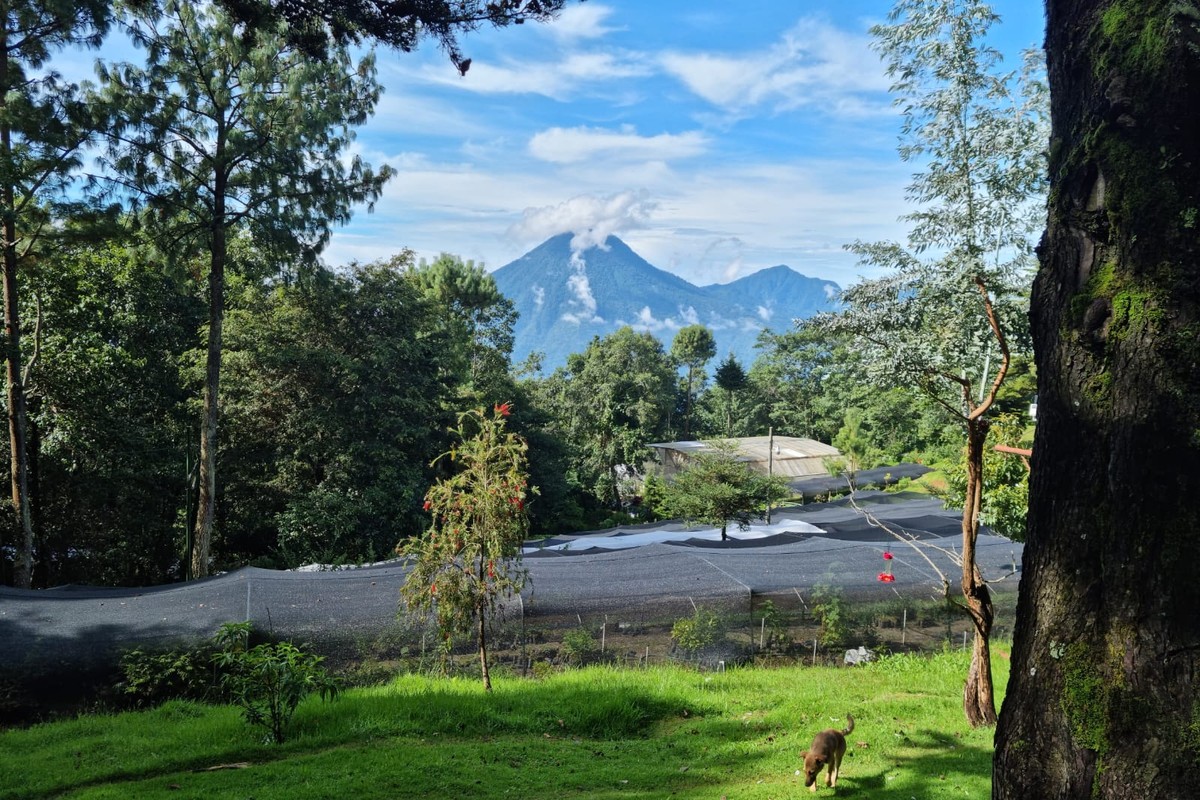
A sombrero, the cloud cap that forms around a volcano's summit.
Daily rainfall is not the only thing these signs are used for, and arguably not the most valuable. Farmers also read them at the sub-seasonal and seasonal scales, for the onset and end of the rainy season, and for dry spells within it. The migration of the Azacuan birds marks the rainy season, beginning when they fly north to south and ending when they return. The ascent of the Pleiades signals that the rains will start within days. Rain falling on 13 June, the Luu cháak, points to a good season ahead. These are the predictions that shape planting decisions, and they become more valuable, not less, during climate extremes such as El Niño and La Niña, when the timing of a decision does most to determine how a crop performs.
What farmers themselves prefer
Alongside the forecasts, farmers were asked which sources they use and which they would rather have. Their own knowledge remains widely preferred, largely because daily forecasts are not specific enough to their location or are simply not good enough at that scale.
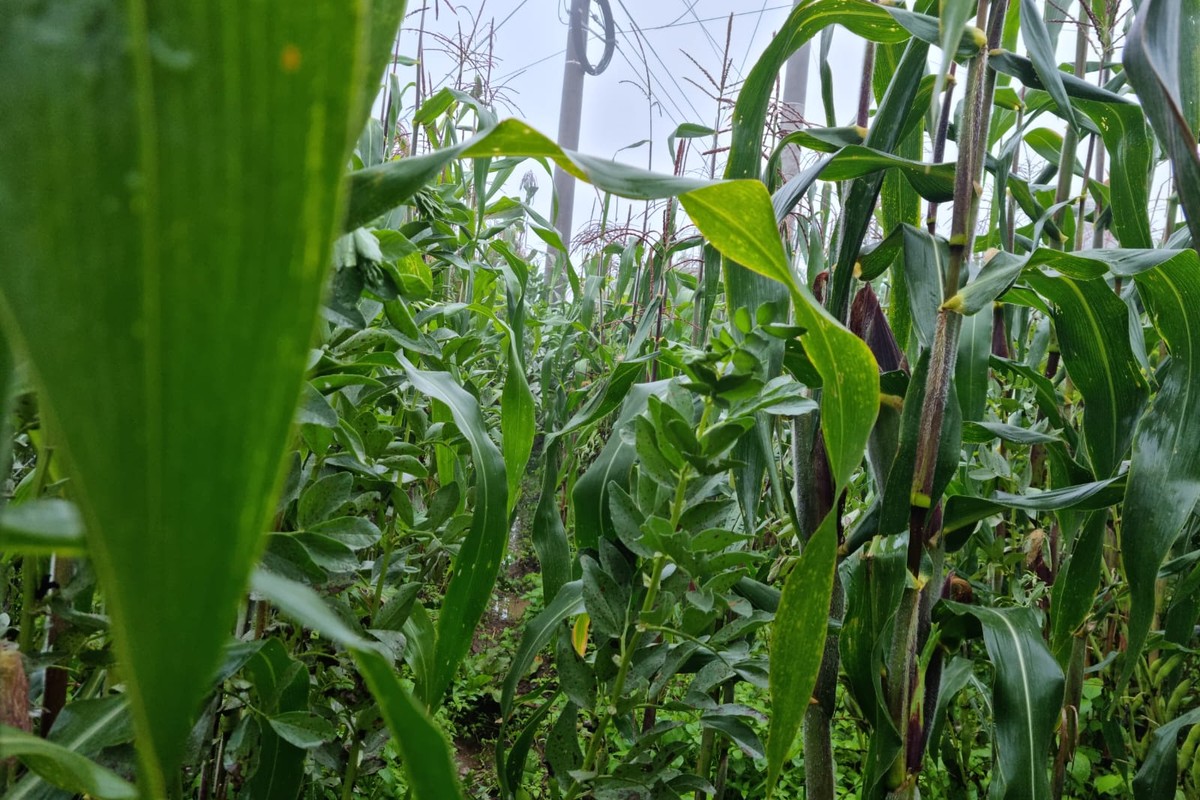
This is not for want of services. Sololá has several, including INSIVUMEH, which issues various kinds of forecasts, and several social media groups where farmers share weather information with one another.
Combine rather than replace
The study suggests that traditional knowledge remains useful, and that its value extends well beyond the daily forecast into the seasonal predictions that drive planting decisions. The sensible conclusion is not to choose one system over the other but to run them together, with local observation filling the gaps a regional forecast cannot reach. A shared service, where farmers and meteorologists contribute observations of local conditions, would serve both better than either could alone. That is already an active line of research, with hybrid forecasts that combine indigenous knowledge with scientific models being tested and evaluated on the same skill measures used here.
The indicators
Daily indicators
| Indicator | Signal | Expected rain |
|---|---|---|
| Ants | Gathering food, high activity | High |
| Ants | Walking and exploring, more dispersed | Low |
| Ants | No activity | High |
| Ash | Volcanic particles falling from the sky | Medium |
| Birds (clay-coloured thrush) | Sound of birds | Medium |
| Birds (swallows, swifts) | Flying and fluttering low | High |
| Birds (cowboy thrush) | Leaving the nest to gather food | Low |
| Birds (cowboy thrush) | Staying in the nest | High |
| Birds (swifts, swallows) | Flapping wings intensively while cleaning | Low |
| Birds (all species) | No sound at all | High |
| Birds (crows) | Flying around | Low |
| Clear sky | Blue sky, minor cloud, no wind | Very low |
| Cloud cover | Cloud covering the sky (stratus, altostratus) | Medium |
| Grey clouds | Grey to dark grey cloud | Low |
| Fog | Heavy fog in the morning | Medium |
| Fog | Fog around the mountains and hills | High |
| Frogs | Fewer frogs present | Low |
| Frogs | Frogs highly active | High |
| Halo | Halo around the sun | High |
| Humidity | Feels humid morning or day | Medium |
| Lightning | Lightning in the distance | High |
| Patterned clouds | Cirrostratus, nimbostratus, stratocumulus | Medium |
| Patterned clouds | Minor cloud (cumulus) | Very low |
| Patterned clouds | Grey vertical cloud with white striping (cumulonimbus) | Very high |
| Patterned clouds | Scattered cloud (cirrocumulus, stratocumulus) | Very low |
| Patterned clouds | Cloud circling the volcano | Medium |
| Patterned clouds | Cloud forming behind the mountain | Low |
| Patterned clouds | Cloud forming on the far side of the lake | High |
| Patterned clouds | Cloud forming in the mountains north of the area | Low |
| Rain | Rain overnight, or signs of rain before 11 am | Medium |
| Sun | Intense sun rays | High |
| Sun | Strong sun with no cloud | Very low |
| Stars | Ascent of the Pleiades (start of rainy season) | Seasonal |
| Storm | Heavy wind with lightning | Very high |
| Temperature | Cold outside, morning breeze | Medium |
| Vegetation | Plants giving off a particular scent | High |
| White clouds | White or regular cloud | Very low |
| Wind | From the north | Very low |
| Wind | From the south or south-east | Medium |
| Xocomíl | Cloud accumulating from the west, rain with wind | Very high |
Daily weather indicators recorded by 27 farmers across five communities in Sololá, Guatemala.
Seasonal indicators
| Indicator | Signal | Period | Prediction |
|---|---|---|---|
| Animals generally | Outside, visible, eating the crops | During the rainy season | Rain soon, or for an extended period |
| Azacuan birds | Migration north to south, then south to north | Onset and end of the rainy season | North to south marks the season starting, south to north marks it ending |
| Azacuan birds | Appearance and colour | Intensity of the rainy season | Mostly white means moderate rain, grey or dark means heavy rain |
| Clay-coloured thrush (sik'il tiox) | Singing at sunset | Onset of the rainy season | The rains will begin soon |
| Halo | Halo around the sun, dominant blue | Through the year and rainy season | Rain soon |
| Halo | Halo around the sun, dominant red | Through the year and rainy season | Some days without rain |
| Milpa (maize) | Farmers planting early | Planting from April to June, initial stage from May to July | Early planting follows an early start to the rains, with the initial stage needing more water. |
| Rainbow | Rainbow in the dry season around the lake | Onset of the rainy season | The rains will begin soon |
| Rainbow | Rainbow with considerable cloud | During the rainy season | Heavy rain coming |
| Stars | Ascent of the Pleiades | Onset of the rainy season | The rains will start within days |
| The moon | Coloured spots forming near the moon, holén | Rainy season | Onset of the canícula, the dry period mid-season |
| Mayan calendar | Rain falling on 13 June, Luu cháak | Before the rainy season | A good rainy season ahead |
| Wind | Many days or months of strong wind | End of the rainy season | The rains are ending and the dry season is starting |
| Xocomíl | The phenomenon itself | All year | Cloud accumulating, rain with wind, usually around midday |
Sub-seasonal and seasonal indicators are used for planting and season-timing decisions.
Sources
Cat-Colli, M. Á. (2015). Xooc K'íin, las cabañuelas mayas. Universidad de Quintana Roo.
Sutanto, S. J., Bosdijk, J., Benedict, I., Moene, A., Milosevic, D., Ludwig, F., and Paparrizos, S. (2025). Next-generation hybrid precipitation forecasts that integrate indigenous knowledge. Environmental Research Letters, 20(7), 074072.
Petrich, P., and García, C. O. (eds.) (2001). Abuela Luna. Cholsamaj Fundación.
Sutanto, S. J., Paparrizos, S., Kumar, U., Datta, D. K., and Ludwig, F. (2023). The performance of climate information service in delivering scientific, local, and hybrid weather forecasts, a study case in Bangladesh. Climate Services, 34, 100459.
Sutanto, S. J., et al. (2024). Integrating user- and data-driven weather forecasts to develop legitimate, credible, and salient information services for smallholders in the Global South. Scientific Reports, 14, 22841.