How difficult can building a model really be? Precision agriculture makes up an ever larger part of modern farming, and models play a central role in it. A model that predicts crop production sounds more complicated still, yet a simple prediction model can be built surprisingly easily with free tools.
What you need
A simple version of the model needs only two tools: QGIS and Google Earth Engine (GEE). AI tools can also help you write, understand and adapt the code.
QGIS is open-source software, and the Sentinel-2 satellite data used here are free for any use. Earth Engine is free for non-commercial and research use, but Google charges a subscription and compute fees for commercial use, so a farm or business using it to run its operations should check whether it needs a commercial plan.
Start by drawing polygons in QGIS around the parcels you want to predict. Then link a table to those polygons and add three things: a field name so you can recognise each polygon later in Excel, the area in hectares or another unit, and the plant spacing in metres by metres. The table then looks like this:
| Field name | Area (ha) | Plant spacing (m × m) |
| Field A | 4.75 | 1.5 × 5 |
Save the polygons with the table as an ESRI Shapefile and upload it to GEE as an asset, through the shapefile table upload. GEE is where you build your own scripts, and with them your own prediction model. You can write the code yourself or ask an AI tool for help, but before you rely on AI or apply the model, make sure you understand how the code works and what it is doing.
How the model works
A very simple predictive model can run from an Excel table alone, but in this example I use free Sentinel-2 satellite data through GEE. The script calculates the Normalised Difference Vegetation Index (NDVI), a widely used measure of vegetation activity, and combines it with the area and plant spacing to make a simple production estimate.
The script multiplies the spacing between rows by the spacing between plants in the row to work out planting density, the number of plants per hectare. This example is therefore designed mainly for orchards, vineyards and other crops planted in regular rows. For cereals and other crops sown without fixed spacing, the model can work from field boundaries alone, but it then needs its own crop-specific calibration.
To get the right satellite information, choose a period when the crop is normally most active, based on your own experience, a cultivation calendar or the literature. The results can then be exported from GEE to Excel. The complete model takes only around 50 lines of code, and the script is available here for anyone who signs in with a Google account that has Earth Engine access through a registered Google Cloud project.
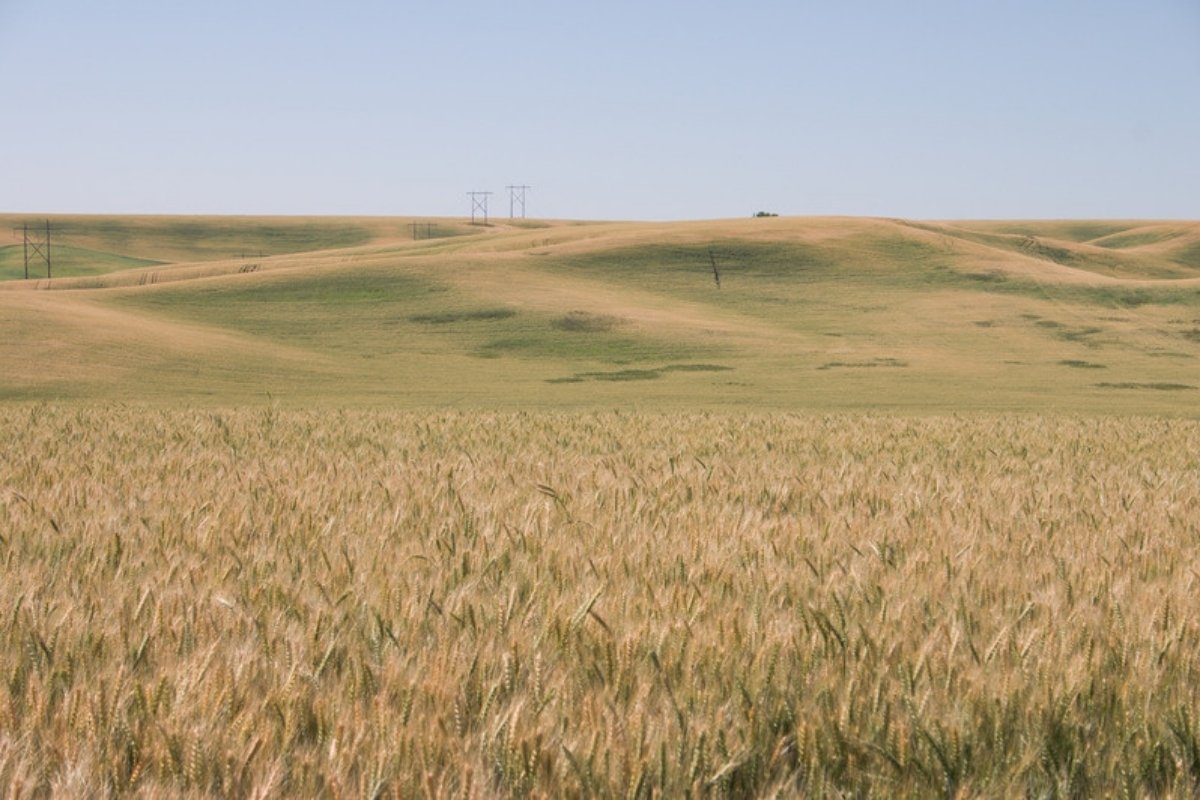
A ripening wheat field. Both Sentinel-2 yield studies cited in this article include wheat.
But is it reliable?
This simple model produces a number for the production of a crop, but that does not make the prediction reliable straight away. Without actual production measurements, or values from the literature to calibrate the relationship, it cannot yet be used in practice.
Fortunately, the relationship between vegetation indices and crop yield is well studied. In Australia, a study across 103 wheat fields found that Sentinel-2 vegetation indices explained around 74 to 76% of the variation in measured yield, with a red-edge chlorophyll index and a soil-adjusted index performing best. In another study, on wheat and barley in a semi-arid region, Sentinel-2 NDVI alone explained about 58% of the variation in observed grain yield. These cereal studies show how closely satellite data and yield are related. They do not validate the model described here.
NDVI can therefore tell you a good deal about crop production, but only once the model is properly calibrated. A simple calibration compares a known actual yield with the model result for the same growth period, so that the calibration factor is the actual yield divided by the model result. This calibration is included as an optional step in the GEE script.
How to improve the model
The model here is deliberately simple, to show that a model does not have to be difficult. With the same free tools, and AI if you want it, it can be expanded into something much more useful and better grounded.
Adding the crop type, variety, growth stage, historical and average yields, and crop-specific factors from the literature makes the model considerably more advanced. That takes more time, but it is still straightforward. GEE also has a data catalogue with many open datasets and worked examples for refining a model, and much more can be extracted from satellite data than NDVI alone. Drones or higher-resolution commercial satellite imagery can add further spatial detail. They are rarely cheap, but they can improve a model considerably. Field measurements remain essential for calibrating the model and keeping it working.
When a model draws on many factors, machine learning can help recognise patterns and combine the data automatically. A more complex model is not automatically a better one, though, and validation against real production data is always necessary.
Build it yourself or use a platform?
With free tools and some time, you can get quite far on your own. In GEE, the number of parcels and inputs makes little difference to how long a result takes, up to a point. With the tools and data now available, a useful model can be built at little or no cost, provided it is calibrated and validated. Some agricultural platforms build largely on the same public data.
That does not mean platforms have no value. Good ones add value by validating and updating their models regularly, and some go further, offering commercial satellite imagery, drones, field measurements and technical support. When you assess a platform, look at how its model works as well as at its results, so you can judge whether its cost is worth more than the time it would take to build a model yourself.
Building a production model is more accessible than it seems, and the same is true of many other models. Producing a result is easy. Validating and maintaining a prediction you can trust is the challenge. With so many platforms and models available, it always pays to look beyond the result to the assumptions, the data and the method behind it.
Sources
- Faqe Ibrahim, G. R., Rasul, A., and Abdullah, H. (2023). Sentinel-2 accurately estimated wheat yield in a semi-arid region compared with Landsat 8. International Journal of Remote Sensing, 44(13), 4115-4136.
- Google. About Google Earth Engine. Google for Developers.
- Zhao, Y., Potgieter, A. B., Zhang, M., Wu, B., and Hammer, G. L. (2020). Predicting wheat yield at the field scale by combining high-resolution Sentinel-2 satellite imagery and crop modelling. Remote Sensing, 12(6), 1024.