


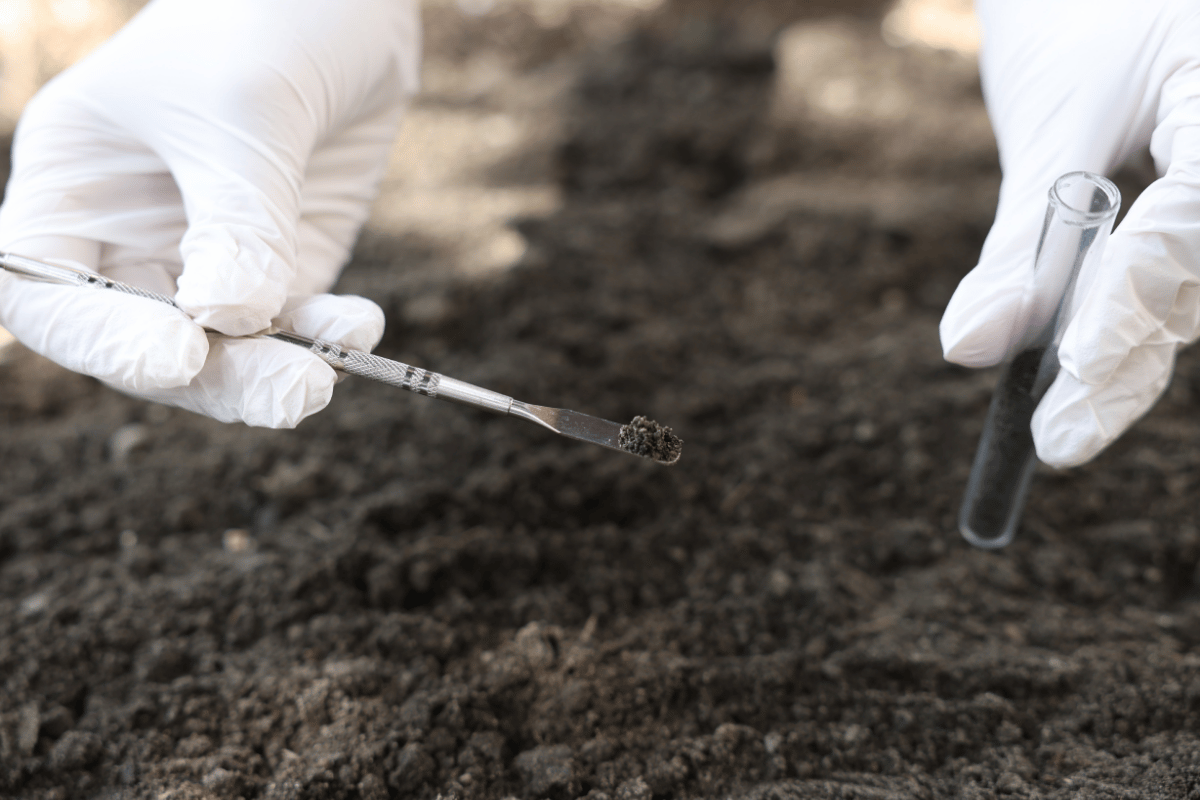
Adapted with permission from the original article published on Soil Health Exchange.
Phospholipid fatty acid analysis (PLFA) is the most reproducible way to measure both living microbial biomass and community structure in soil simultaneously. It can detect shifts in fungal abundance, bacterial stress, and mycorrhizal networks that no chemical soil test can see, and it responds clearly to management: meta-analyses show gains of around 24% in total microbial biomass under cover cropping, 59% under organic amendments, and 37% after tillage stops. Yet for all that sensitivity, PLFA remains one of the least prescriptive tools an agronomist can order. After three decades of research, there are still no validated thresholds for a "deficient" or "optimal" value, no calibration linking a PLFA number to a yield outcome, and enough variation between laboratories that the same soil can be read two opposite ways. The honest way to use PLFA today is as a directional compass, not a prescription.
How phospholipids become a census of the living soil
Every microbial cell, whether bacterium, fungus, or protozoan, wraps itself in a membrane built from phospholipids: molecules with a glycerol backbone, two fatty acid tails, and a phosphate head. The fatty acid tails differ in length, branching, and saturation in ways that are characteristic of broad microbial groups, so reading the mix of fatty acids in a soil is a way of taking a census of who is living in it. Gram-positive bacteria carry branched iso- and anteiso-fatty acids, gram-negative bacteria carry monounsaturated and cyclopropane forms, saprophytic fungi are marked by linoleic acid (18:2ω6,9), arbuscular mycorrhizal fungi by 16:1ω5c, and actinobacteria by distinctive methyl-branched chains. A single extraction profile shows the relative abundance of each major functional group.
The decisive advantage over DNA-based methods is that phospholipids degrade rapidly once a cell dies, with a half-life of roughly 20 hours at 25°C, so what PLFA detects is overwhelmingly the living community. Relic DNA, by contrast, can persist for months or years and inflate estimates from sequencing. PLFA also gives an absolute quantity of biomass, in nanomoles per gram of soil, which lets you tell a community that has actually doubled in size from one that has merely shifted in proportion. DNA metabarcoding gives only relative abundances and cannot make that distinction.
The laboratory route involves lipid extraction, separation of phospholipids from storage fats, conversion to volatile methyl esters, and measurement by gas chromatography against known standards. A miniaturised 96-well version now processes 96 samples in about a day and a half, which is what made commercial testing practical. A typical commercial PLFA test costs around $ 55 to $ 85 per sample, with a one- to two-week turnaround.
Where PLFA falls short is in fine detail. It separates perhaps a dozen functional groups, whereas DNA sequencing resolves thousands of species; it misses archaea whose membranes resist the method; and some markers are imperfectly specific, since straight-chain fatty acids occur in all microorganisms yet are sometimes counted as bacterial. Even so, a 2025 comparison found PLFA to be the most precise and repeatable method for assessing the fungal-to-bacterial ratio, and it was used in 81% of published studies on that metric.
The five sub-fractions that matter most for management
Total PLFA biomass sets the baseline
The sum of all phospholipid fatty acids estimates the total living microbial biomass, and published values span roughly an order of magnitude with land use. Native grasslands and forests commonly sit in the hundreds of nanomoles per gram, productive arable soils in the tens, and degraded soils can fall below 20 nanomoles per gram. In one striking case, prairie strips established for 12 years held 234% more total PLFA than the cropland beside them, while ploughing up grassland stripped away a large share of microbial biomass carbon within the first month.
Total PLFA tracks soil organic carbon closely, making it partly redundant with a carbon measurement. Still, it has the useful property of detecting biological change before it shows in the carbon number. For a practitioner the directional rule is simple: more total PLFA generally means more biological capacity for cycling nutrients, processing organic matter, and suppressing disease. The living side of that capacity is the community of soil microorganisms the test is counting.
The fungal-to-bacterial ratio shows which decomposition pathway dominates
The fungal-to-bacterial ratio, the fungal marker divided by the sum of the bacterial markers, captures a basic ecological split. Fungal-dominated decomposition goes with greater carbon-use efficiency, slower nutrient release, better soil aggregation through hyphal networks, and stronger carbon storage. Bacterial-dominated decomposition drives fast nutrient release and processing of easy substrates but can mean more nitrogen leaching and carbon loss. Intensive tillage, heavy nitrogen fertilisation, and frequent disturbance push a soil toward bacteria; reduced tillage, perennial cover, high-carbon residues, and organic amendments push it toward fungi.
Published ratios run from about 0.10 to 0.20 in intensively managed cropland up to around 0.16 to 0.26 in organic systems, with acid forest soils much higher. Some extension guidance suggests a ratio around 0.3 as a practical target for faster residue breakdown and better structure. The ratio comes with real caveats, though. Different methods give different ratios for the same sample, the fungal marker can be confounded by plant root tissue, and one meta-analysis found that conservation tillage raised fungal biomass by 31% without shifting the ratio, because bacterial biomass rose too. The ratio reflects balance, not absolute abundance, and can hide what is happening underneath.
Mycorrhizal markers trace the fungal network
The fatty acid 16:1ω5c marks arbuscular mycorrhizal fungi, the symbiotic partners that link most plant species to soil phosphorus and to one another through shared hyphal networks, and that help bind soil into stable aggregates. This marker moves sharply with management. Under composted farmyard manure it ran about 80% higher than under mineral fertiliser in a long-term Swiss trial, and turning set-aside grassland back into cropland cut it by more than half as tillage tore the hyphal networks apart. Continuous cropping with non-mycorrhizal plants such as brassicas suppresses it further, while rotation with mycorrhizal hosts and cover cropping maintains or builds it. The role these fungi play is covered more fully in the article on the importance of mycorrhizae in agriculture. A storage-lipid version of the same marker gives a cleaner mycorrhizal signal where bacterial background would otherwise interfere.
The gram-positive to gram-negative ratio signals carbon availability
The balance between gram-positive and gram-negative bacteria maps onto how much easy carbon a soil has. Gram-negative bacteria prefer fresh, plant-derived carbon such as root exudates and dominate the active root zone; gram-positive bacteria lean more on older, harder-to-use soil organic matter and dominate deeper and carbon-poor horizons. A rising gram-positive to gram-negative ratio therefore warns of declining fresh carbon and, with it, declining biological function. Organic fertilisation lowered that ratio in long-term studies, a shift toward conditions rich in fresh substrate.
Stress markers reveal the physiological state of the community
When gram-negative bacteria run into stress, from drought, starvation, acidity, heavy metals, or temperature extremes, they convert certain membrane fatty acids into cyclopropane forms. The ratio of those cyclopropane forms to their precursors works as a real-time stress signal. This matters for interpretation as much as for diagnosis, because stress markers rise during seasonal drought, and seasonal swings in PLFA can be larger than the difference between whole management systems. When you sample is therefore part of what you are measuring.
What the numbers actually mean across different soils
The hardest part of PLFA is that there are no universal benchmarks. Unlike soil phosphorus, where decades of field trials have tied critical values to crop response, no validated sufficiency or deficiency threshold exists for any PLFA indicator. Extension services say so directly: there is no baseline for biological testing the way there is for chemical analysis, and official guidance describes PLFA values as directionally understood, higher being better, while the ranges tied to soil function stay poorly defined.
The reason is that a soil's own inherent properties, its texture, pH, organic matter, and climate, drive PLFA variation more than management does. A dataset of more than 1,800 samples across 124 North American sites found that region mattered more to the PLFA profile than farming practice. A silt loam in Iowa under continuous corn can show more total PLFA than a sandy loam in Georgia under a diverse cover-crop rotation, simply because it holds more organic matter and water. Most of the variation in PLFA reflects carbon content, not management quality.
Within that constraint, consistent management signals do come through, and they are worth seeing side by side.
| Management comparison | PLFA response | Source |
| Organic vs conventional farming | +59% total PLFA | Lori et al. 2017, 56 papers |
| Conservation vs conventional tillage | +37% total biomass, +31% fungi, +11% bacteria | Chen et al. 2020, 60 studies |
| Cover crop vs bare fallow | +24% total PLFA | Muhammad et al. 2021, 81 studies |
| NPK plus manure vs NPK alone | +110% total PLFA | China meta-analysis, 109 sites |
| Nitrogen fertiliser alone vs unfertilised | −7% total PLFA | Same meta-analysis |
| Prairie strips, 12 years, vs adjacent cropland | +234% total PLFA | Dutter et al. 2025 |
Effect sizes are means across studies; individual sites vary with soil type and climate.
Because inherent properties dominate, the scientific consensus favours treating PLFA as a trajectory rather than an absolute value. Comparing the same field to itself over time, sampled the same way, removes most of the confounding from soil type. Official guidance endorses exactly this: collect and analyse over several years and see whether the numbers are moving in the desired direction. The minimum useful monitoring period is about three to five years, longer in arid regions, holding timing, depth, and laboratory constant to avoid artefacts.
The gap between measuring soil biology and managing it
A farmer holding a PLFA report faces a real disconnect. A chemical soil test answers how much fertiliser to apply, with rates calibrated to crop response over decades of trials. A PLFA test answers what is living in the soil, and no validated bridge yet connects that answer to a decision. One major soil-health programme, after evaluating more than 30 indicators across 124 long-term sites, excluded PLFA from its recommended minimum set of three measurements, citing interpretive complexity and the cost relative to the information gained.
Reproducibility between laboratories compounds the problem. When four well-characterised soils were sent to two recognised PLFA laboratories, total biomass differed by a factor of two, and the derived ratios were substantially different, in two cases pointing in opposite directions. One laboratory even assigned its most favourable biological result to the most depleted soil from a 30-year continuous-corn trial. There is no shared proficiency-testing programme for PLFA laboratories, and different labs build even basic metrics from different combinations of markers.
Sample handling adds another vulnerability. Air-drying a sample can cost 11 to 16% of the PLFA signal, oven-drying around 38%, and two weeks at room temperature causes significant degradation, with the gram-negative and fungal markers hit hardest. That skews every ratio that depends on them. For a farmer-collected sample that may sit in a truck cab or a barn before shipping, this is a practical hazard with no easy fix, and it is the strongest argument for consistent handling and a single laboratory over time.
Despite all this, PLFA does move with management in a predictable order, and knowing the hierarchy is what makes the test useful:
- Organic amendments such as manure and compost give the strongest lift to total PLFA and bacterial biomass, often within a single season.
- Stopping tillage strongly raises fungal markers and the fungal-to-bacterial ratio, especially in the top few centimetres, with mycorrhizal markers particularly responsive.
- Cover cropping gives a moderate rise in total PLFA and favours fungi, with mycorrhizal markers responding when mycorrhizal host species are included.
- Diverse crop rotations shift community composition more than they change total biomass.
- Nitrogen fertiliser alone, without any organic carbon input, can actually lower total PLFA, which cuts against the assumption that fertilising always feeds soil life.
The timeline matters too: cover-crop effects can appear within one to two growing seasons, and fungal markers can respond to tillage cessation within one to three years, but reliable trend detection still needs three to five years of consistent monitoring, because seasonal variation alone can exceed the management signal. The link from PLFA to yield remains thin; the firmest connections are to nutrient-cycling processes such as nitrogen mineralisation, suggesting that the biology PLFA detects does help supply nutrients, even where a direct yield relationship is hard to pin down.
How to use PLFA well
PLFA is a genuinely powerful window into the living soil, and the practices that build soil biology, cover cropping, reduced tillage, and organic amendments, are the same ones that improve soil health more broadly. The mistake is to read a single report as a verdict. Used as a compass, tracked on the same field over several years, with consistent sampling and one laboratory, PLFA shows whether your management is moving the biology in the right direction. Used as a prescription, compared against thresholds that do not yet exist, it will mislead. For now, the value is in the trend, not the number.
Sources
This article is adapted with permission from Dr. Saurav Das, PLFA analysis, what soil biology testing can and cannot tell you, Soil Health Exchange (2026), where the full version with complete references is available.
Key studies referenced include Lori et al. (2017) on organic management, Chen et al. (2020) on conservation tillage, Muhammad et al. (2021) on cover crops, Norris et al. (2023) on total PLFA and soil organic carbon, and Joergensen (2022) on PLFA biomarkers.