


Precision farming has given us access to more data about our fields than ever before. Satellite imagery, yield maps, soil tests, and weather records all help build a picture of what is happening to a crop. The difficulty is no longer getting hold of data. It is interpreting it.
A single satellite image, or a vegetation index captured on one date, gives only a snapshot. You would not judge an athlete on one competition, and a field cannot be judged on one image either. What matters is how a field behaves across many growing seasons, because that is where patterns of productivity, stability, stress tolerance, and overall performance become visible. Those patterns cannot be seen in an individual observation.
Reading them requires multi-year datasets. This article describes an approach I have developed for that purpose, called FieldDNA. A research collaboration with several research institutes is currently being established to investigate a forward-looking extension of the method based on climate predictions. It sets out to characterise a field's long-term behaviour rather than its condition on a particular day, so that a grower can tell which areas are reliable, which perform well only under favourable conditions, which are sensitive to stress, and where a different cultivation strategy, or in extreme cases a different crop, is worth considering.
Why one satellite image is not enough
Most growers have now seen NDVI or similar vegetation index maps, where red, yellow, and green patches show the state of the vegetation. They are genuinely useful for day-to-day decisions, and on their own they can also mislead.
A red patch might indicate any of the following:
- temporary water shortage
- nutrient deficiency
- soil compaction
- wildlife damage
- simply delayed crop development
From one image there is no way to tell whether the problem is persistent. A single image can be enough to plan a one-off nutrient application. Working out whether a zone is a permanent feature of the field, or an artefact of one season's weather, needs several years of data. That distinction determines the response. It tells you whether an extra dose of nitrogen this season will do, or whether the spot needs different management altogether because the problem will return.
What field diagnostics look like
Fields have a memory, and they express it through their long-term behaviour. Every field has a character of its own. Some zones perform well almost every year. Others produce good results only when the weather cooperates. Analysed together across several growing seasons, satellite observations and crop condition data make that character legible, and from it you can infer a field's productivity, its stability, its tolerance of stress, and its overall risk profile.
Four indicators, not one
The approach describes field performance through four complementary indicators.
Crop productivity. The long-term average vegetation performance of a field, based on satellite data from multiple dates and independent of the crop grown. It reflects biomass production potential rather than harvested yield.
Stress tolerance. How well the vegetation withstands seasonal and environmental stress, recovers from it, and adapts to it.
Absolute stability. The field's spatial consistency, meaning how uniform the plant stand is within the field across the whole study period.
Relative stability. The field's temporal stability, meaning how repeatable its vegetation behaviour is from season to season.
Each indicator is informative by itself. Their real value emerges when they are read together.
Why the whole system is assessed, not its parts
FieldDNA rests entirely on multi-year satellite observations. Instead of examining individual site factors such as soil, water availability, or topography in isolation, it evaluates how the whole system responds, using the vegetation condition of the crop as the signal. Those responses carry the combined effect of natural conditions, meaning soil, topography, microclimate, and water management, together with the effect of management decisions.
In practice these two cannot be separated, and there is no need to separate them. A field and the way it is farmed form a single risk system. Natural conditions set the physical and ecological potential of the land, its likely yield level, its natural variability, and its limits. Management practices such as irrigation, nutrient application, species and variety choice, and land use activate that potential, and they can raise or reduce risk and shift the trade-off between yield and stability. The aim is not to apportion effects between site and management, but to assess what the two produce together, which is what tells a grower the actual level of risk carried by a given field under the conditions observed.
The diagnostic matrix
Selecting two indicators displays them in a colour-coded three by three matrix. One indicator sits on each axis, each classified as low, medium, or high, which produces nine diagnostic classes. A code of 33 means both indicators are high, while 11 means both are below average.
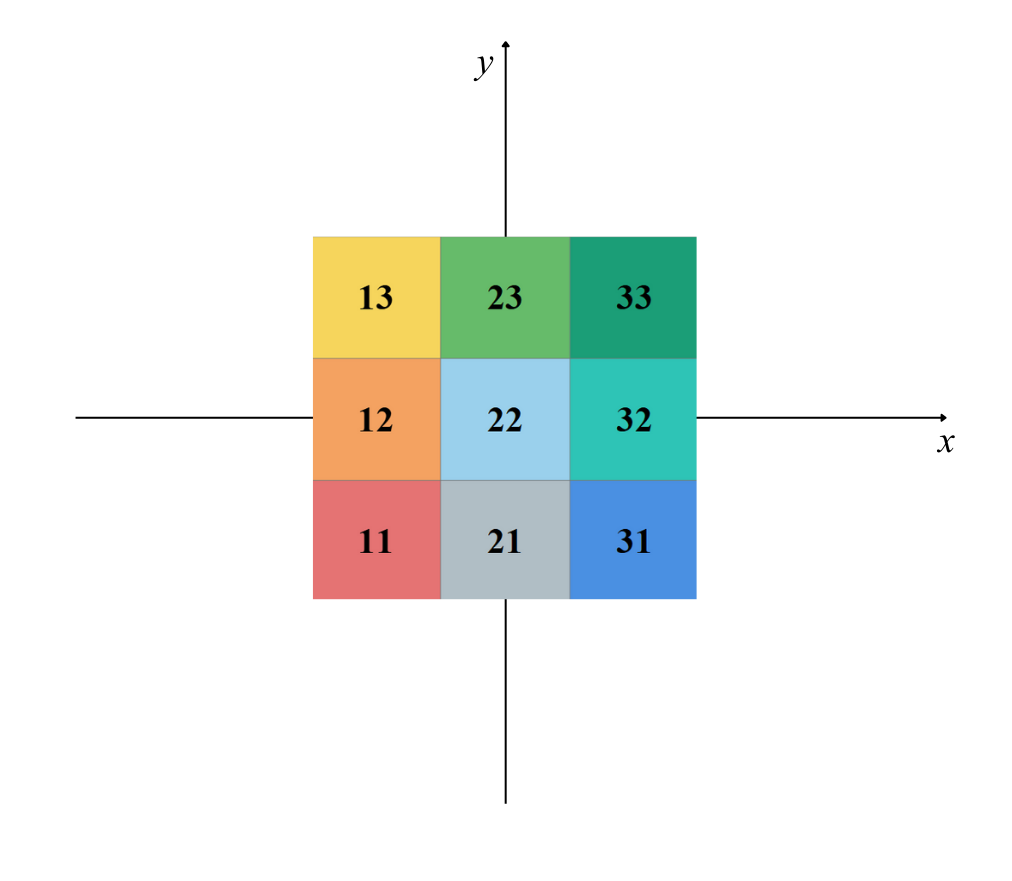
The diagnostic matrix. Each indicator is classified low, medium, or high, giving nine classes. A code of 33 means both indicators are high, 11 means both are below average.
Bivariate maps for informed decisions
The more useful step is analysing how the four indicators relate to one another. Examined in two-variable decision spaces, fields stop being single numbers or rankings and become distinct diagnostic profiles that can be mapped.
Crop productivity against stress tolerance asks how high productivity is and how reliably it can be maintained. The interest here is not record yields but fields that hold their performance through an unfavourable season.
Crop productivity against absolute stability asks whether high productivity is also consistent. A good field average can conceal wide variation inside the field, and this pairing shows whether performance is genuinely even or whether a few strong patches are carrying the average.
Stress tolerance against relative stability asks which fields adapt to extreme weather over the long term. Climate-resilient ground performs well repeatedly rather than once.
Absolute stability against relative stability addresses predictability, and separates fields that genuinely perform reliably from those where apparent stability conceals substantial differences underneath.
.png)
Crop productivity against stress tolerance under real-world agricultural conditions. Each field carries a diagnostic class rather than a single score, so a grower can see at a glance which ground is optimal and stable, which is high-yielding but vulnerable, and which is in critical condition.
A user guide, the Field Diagnostic Manual, accompanies the system. It gives each diagnostic class a map colour and a practical interpretation of the code, explaining what a field's risk classification means for the farmer, which cultivation practices suit it, how it bears on agricultural insurance and ESG reporting, and what it can tell crop breeders. The map is a basis for understanding the underlying constraints on a field and for working out which practical steps follow from them.
A foundation for differentiated farming
The first step in precision farming was collecting reliable, systematic data. The second is understanding the relationships within it. A diagnostic framework built from long-term satellite observations points that way, showing not only yield potential but the adaptability, stability, and risk profile of the land.
Under a changing climate, agricultural competitiveness rests increasingly on reliable, predictable performance rather than on record yields. The farms that gain an advantage will be the ones that know both where crops perform well and which fields can sustain that performance through extreme conditions over years. Decision spaces and diagnostic matrices built on multi-year crop behaviour offer a practical decision-support framework for exactly that.
What these maps do, and what they do not
It is worth being clear about the limits. This approach does not help with today's decisions. It helps with long-term strategy. It does not predict next year's yield, it does not replace field scouting, and it does not diagnose the specific cause of a problem. What it does is reveal the long-term behaviour and risk profile of your fields, which supports decisions about where to invest, where to reduce risk, and where a change in management is most likely to pay.