

Agriculture 4.0: Simulating the common wheat phenology
Summary
The article discusses the use of predictive algorithms in modern agriculture, focusing on a phenological development model for common wheat (Triticum aestivum L.). These models, integrated into Decision Support Systems (DSS), help farmers optimize agricultural practices by predicting crop growth stages based on meteorological data, particularly Growing Degree Days (GDD) and photoperiod adjustments. The study tested the model across six different agricultural sites in Italy, validating it against field observations. Results showed a 66% accuracy in predictions, with reliable estimates for critical stages like booting (BBCH 41) and flowering (BBCH 65), which are crucial for fertilizer and pesticide application. The study highlights the potential of AI-driven models to enhance precision agriculture, although minor discrepancies due to climate variations were noted.
Key Takeaways
- Predictive models in agriculture enhance decision-making by forecasting crop growth stages.
- The model relies on Growing Degree Days (GDD) and photoperiod to estimate wheat phenology.
- It uses the BBCH scale to standardize plant development stages.
- Field validation confirmed high accuracy, particularly in the booting and flowering stages.
- Integration with weather forecasts can improve pesticide application and disease prevention.
Introduction
The prediction of natural phenomena, with great attention to their impact on agriculture, has always been a key goal for farmers. In the past, the only available tool was knowledge of crops and the local territory. Today, new effective methods have emerged to improve decision-making: we are talking about DSS (Decision Support Systems), which are algorithms capable not only of estimating the presence and extent of a phenomenon currently affecting the field but also of predicting its future development based on meteorological trends and soil characteristics where the crop is grown. The use of predictive algorithms (or models) represents a great opportunity for all players in the agricultural sector, whether for large-scale analyses—enabling the simultaneous monitoring of different territories—or for more localized applications, providing alerts in case of imminent risks for the crops.
The Role of AI in Predicting Crop Growth
There are several decision-support algorithms available for agricultural applications, but one of the most fundamental is the plant phenological development model. Knowing and predicting the growth stage of a specific crop is crucial for determining the optimal timing for various farming practices. Moreover, it serves as an essential parameter for calibrating more complex predictive models (for example, water, nutrient, and biotic stress simulations depend on the accuracy of phenological predictions).
The Agricolus platform offers various phenological development models designed to map the growth of multiple crop species. This article introduces one of the most widely used models: the common wheat (Triticum aestivum L.) phenological development model.
How Decision Support Systems Enhance Agriculture
Growing Degree Days (GDD) and Photoperiod in Crop Models
The model's starting point is data provided by weather stations. Indeed, meteorological inputs make it possible to estimate how much "heat" a crop has absorbed during its growth period. One of the most commonly used methods for standardizing the estimation of crop growth across different territorial districts is the daily calculation of accumulated Celsius degrees (technically called Growing Degree Days - GDD). Heat accumulation is lower in colder regions than in warmer areas, resulting in slower crop development. Additionally, other correction factors can be integrated to improve the model’s accuracy. For example, the algorithm used in this study applies a correction based on photoperiod, which considers the number of hours of daylight (photoperiod) on a given day, a factor that varies according to the time of year and latitude.
Understanding the BBCH Scale for Wheat Development
Once these data are processed, the next step is to translate the GDDs into the BBCH scale. At this point, it would be useful to remind that:
The BBCH scale (Biologische Bundesanstalt, Bundessortenamt und CHemische Industrie) is a standardized system for identifying the phenological growth stages of plants, including crops, fruits, and trees. It provides a uniform coding system that allows agronomists, farmers, and researchers to describe plant development in a consistent way.
The BBCH scale uses a two-digit code:
- The first digit (0-9) represents the principal growth stage (e.g., germination, leaf development, flowering).
- The second digit (0-9) provides a more detailed sub-stage within each principal stage.
Key BBCH Growth Stages for Wheat
Since the model is a simplified simulation of reality, wheat development is divided into six key phases that are critical for optimizing farming operations:
- Sowing (BBCH 0)
- Emergence (BBCH 9)
- Tillering (BBCH 21)
- Stem elongation (BBCH 31)
- Booting (BBCH 41)
- Flowering (BBCH 65)
- Maturity (BBCH 83)
An interesting feature of this predictive algorithm is that farmers (or agronomists) can integrate field observations. Even though predictive models can achieve reliable estimates, they inherently have a margin of error, especially when crops are affected by unforeseen external factors or extreme environmental conditions. If the simulation provided by the model differs from reality, the farmer can manually input the correct phenological stage into the platform, allowing the model to adjust its predictions accordingly.
Field Validation and Accuracy of the Predictive Model
How is Data Collected in Agriculture?
After selecting and calibrating the algorithm, it is essential to compare the predictions with actual field conditions. To do this, field surveys are necessary to assess the accuracy of computer-generated simulations. Additionally, testing algorithms across agricultural districts with different climatic conditions is particularly crucial in Italy due to the country's high variability in soil and climate conditions.
Unlike other industries, data collection in agriculture is generally more labor-intensive and costly. This is due to the need to follow the natural crop growth cycles and the time required for field inspections. The process began with the weather station installations near the monitored fields to obtain precise and reliable simulations. Next, regular field visits were conducted, with fields divided into homogeneous areas to ensure the highest level of detail in data acquisition. This method was used to eliminate the impact of zones with different production characteristics, and satellite imagery was used for this purpose. Thanks to data from the Sentinel-2 satellite constellation provided by the European Space Agency (ESA), it was possible to identify field areas that best represented the variability of each site. For each sampling day, the phenological data of each homogeneous zone were recorded. The acquired data were then averaged to obtain a representative sample of the entire field.
Study Fields and Case Studies
This experimental study analyzed six case studies across different territories over two growing seasons, 2022- 23 and 2023-24. All examined fields belonged to two farms in Piedmont, one in Emilia-Romagna, one in Umbria, and one in Friuli-Venezia Giulia, where common wheat was sown. For data collection, SATA, a company specializing in integrated consulting and monitoring services for the agri-food sector, provided support in field sampling and model validation. There were some differences in sampling procedures between farms, influenced by changes in the technicians who collected the data due to the geographical distance between farms. Additionally, slight modifications in approach occurred between the 2022-23 and 2023-24 seasons. The observations collected across all study sites totaled 111 field data points, which were crucial for validating the model’s accuracy.
Results and Model Performance
In Figure 1 (see below), the green line (---) represents the simulated phenological development, while the orange dots (•) indicate actual field observations. The model simplifies crop development by dividing it into main stages, a methodology that remains effective for decision support, as it captures the most critical growth phases.
Key Findings: Accuracy and Limitations
- The model was highly reliable in predicting booting (BBCH 41) and flowering (BBCH 65) stages, which are crucial for timing nitrogen applications (to enhance grain protein content) and maximizing crop yield potential.
- Integration with weather forecasts can help optimize the timing of pesticide applications, improving their effectiveness in disease prevention.
- Some deviations were observed from tillering to stem elongation (BBCH 21 to 31). In cases 1, 2, and 4, the algorithm predicted stem elongation earlier than expected, likely due to the high winter temperatures recorded in 2022-23, which influenced the model’s calculations.
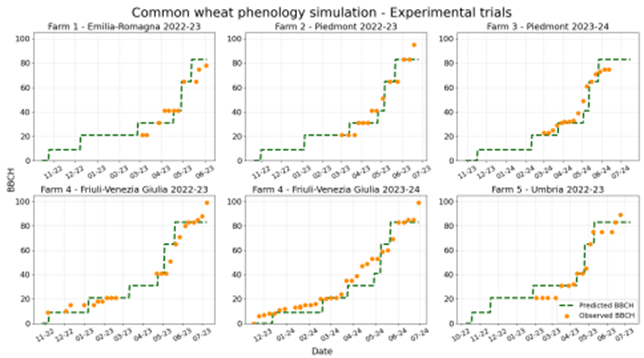
Figure 1: Wheat phenological development time-trend in the six case studies considered; the green lines represent the phenological stage simulations generated by the predictive model, while the orange dots indicate the field samples.
Conclusion: Advancing AI-Driven Agriculture
A confusion matrix (Figure 2) was constructed to evaluate the model's reliability further and help identify classification errors. The matrix shows correctly classified values on the diagonal (bottom-left to top-right), while misclassified values are in the adjacent cells. The majority of predictions aligned with field observations, although some errors were noted, particularly in the booting stage, where precise estimation is more challenging due to its short duration (anyway the model errors relating to this period are slight as can be seen in figure 1).
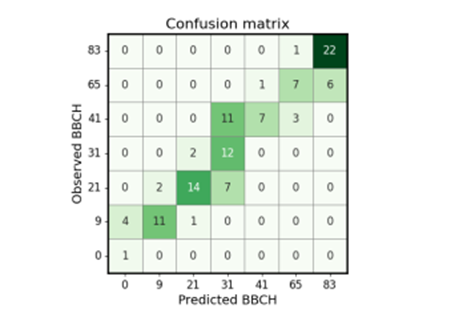
Figure 2: Confusion matrix for analyzing the classification reliability of the algorithm.
The field tests confirmed the model's reliability as a decision-support tool. The prediction accuracy reached 66% (correct predictions out of total cases), with a precision of 74%, which is encouraging. The maximum
deviation was only a few days, which is negligible for practical agronomic management. Thanks to ongoing research and field trials, phenological development models are becoming increasingly accurate, paving the way for even more reliable and advanced algorithms. By following the scientific method, we will continue to study, formulate hypotheses, test them in the field, and refine our models, driven by the promising results that this innovative approach to agriculture is delivering.
Further reading
Decision Support Systems in Crop & Weed Management: Benefits for Farmers
Enhancing Wheat Yield and Nutritional Quality Through Agronomy and Genetics
Vineyard Management Using Advanced Precision Viticulture Techniques
