

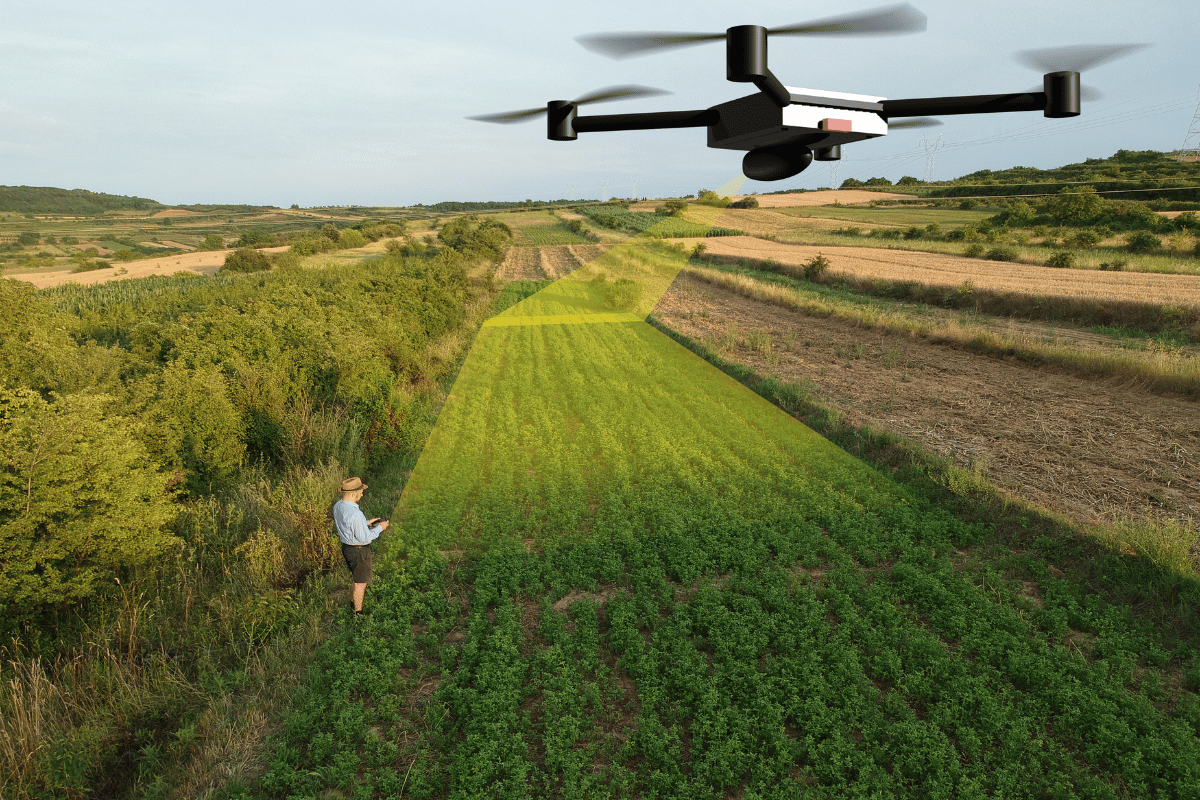
Walk to one corner of a field and dig a hole, then do the same in the opposite corner. Often you will find two different soils: more clay in one, more sand in the other, a wet patch here, thinner topsoil there. Farmers have always known their land is not uniform. The hard part was never knowing the variation existed. It was mapping it finely enough to act on, without paying for a soil sample every few metres. That is the gap Digital Soil Mapping tries to close.
What Digital Soil Mapping is
Digital Soil Mapping (DSM) predicts soil conditions where you never took a sample. You start with real soil measurements, then combine them with data describing the landscape: elevation, slope, rainfall, satellite images, and land use. A computer model learns how the soil relates to the landscape and fills in the blanks between your sample points.
This is not a fringe technique. It underpins national soil databases, precision agriculture, and the soil carbon projects now being audited across Europe. What matters is understanding what DSM is not. It does not invent soil data out of thin air. It stretches the samples you already have across a wider area. No samples, no reliable map.
Where Digital Soil Mapping came from
Most people meet Digital Soil Mapping as a new product with a subscription attached. It is older than that. Soil scientists were building numerical soil maps in the 1990s, and the ideas run deeper still: sensing soil directly in the field was proposed in the 1920s, and soil spectroscopy in the 1970s. Each waited decades for the data and computing power to catch up.
What changed around 2000 was that several things arrived at once: cheap elevation models, satellite imagery, computing power, and a growing demand for soil data with honest estimates of their own uncertainty. In 2003, McBratney and colleagues gave this scattered body of work a single framework. They named the field rather than founded it. The science underlying these tools is neither new nor untested. It simply became affordable.
What goes into a digital soil map
Three ingredients matter, in order of importance.
- Real soil samples: the foundation. Organic carbon, pH, clay content, bulk density, and nutrients measured in a lab. Everything the model produces is only as good as these measurements. Many come from national databases, which FAO's Global Soil Partnership is working to open and make comparable across borders. Samples measured by different labs to different standards do not combine cleanly.
- Landscape and environmental data: topography matters most, because slope and water flow determine where soil erodes, accumulates, or stays wet. Climate explains long-term differences in temperature and biological activity. Satellite images add crop growth, bare-soil colour, and moisture patterns.
- The model: older maps used geostatistics; today most use machine learning such as random forests. Global platforms like SoilGrids use exactly this approach worldwide, which shows the method scales from a single farm to a whole continent.
What you can get for free, and what you cannot
Two open services are worth knowing. SoilGrids, from ISRIC, predicts soil properties globally on a grid of roughly 250 m. OpenLandMap publishes open global soil and land layers at 30 m resolution, several of which include prediction uncertainty. Both are useful and cost nothing.
The gap between them is instructive. A 250 m pixel can swallow a management zone whole, so SoilGrids tells you about the landscape your farm sits in rather than the field you are standing on. OpenLandMap's 30 m grid is fine enough to show a pattern inside a large field, which is where the trap lies. A finer grid is not a more accurate map. The pixels got smaller. The soil samples underneath them did not necessarily get denser, closer, or newer. Use either to understand your landscape, to decide where to sample, or to sanity-check a map somebody is selling you. Neither replaces measurements when a carbon baseline is at stake.
What it does well
DSM earns its keep in four ways.
It breaks the field into zones: where carbon is higher, where clay changes, where acid patches need lime. That drives variable-rate application, tillage decisions, and where to put cover crops.
It makes sampling smarter, not unnecessary. You still need to dig, but a handful of well-placed soil samples plus landscape data beat blanket sampling at a fraction of the cost.
It scales if you feed it. Satellite imagery plus existing soil databases can map soil carbon across whole regions, and adding a modest amount of targeted new sampling, known as support sampling, clearly beats leaning on existing datasets alone. This has been demonstrated on European soils, but nothing about it is uniquely European. Wherever you have satellites, some legacy data, and permission to dig, the same logic holds. The shortcut is not to skip sampling. It is to sample in the right places.
It underpins carbon programmes, through credible baselines, stratification, and defensible decisions about where to re-sample. The map itself is never the point. The decision it helps you make is.
Where it falls short
DSM is powerful, but it is not a crystal ball, and treating it like one is how people get burned. If your samples are sparse, poorly distributed, outdated, or measured inconsistently, the model will still produce a clean, professional-looking map that is simply wrong. A good-looking map is not a correct one. Machine learning can also be accurate but opaque: if a map contradicts what you see on the ground, that is a reason to check, not to follow blindly.
The deeper problem is that every number on the map is uncertain, and most products do a poor job of telling you by how much.
Why uncertainty matters more than accuracy
Every value on a digital soil map is an estimate, not a measurement. The map says 1.8% organic carbon. The truth might be 1.4% or 2.3%. A credible product specifies its range. A poor one presents a confident number and lets you assume it is a fact.
The error comes from three places, the samples, the environmental layers, and the model itself, and all three should be measured and shown to the user, not quietly hidden. Five ways it bites:
- Fine pixels are not accuracy. Resolution is how finely the picture is drawn. Accuracy is whether it is right. Vendors quote resolution first.
- Maps flatten the extremes. Models pull predictions toward the average, so poor patches look less poor and good ones less good. The extremes are exactly where you would have acted.
- It is weakest where you never sampled. On ground unlike anything in the training data, the model still returns a number. It has no basis for that number, and nothing on the map warns you.
- Reported accuracy flatters. Validation points sitting beside training points test the model on ground it has already seen. Independent, well-spread points are the honest test.
- Change is harder than staying the same. Soil carbon shifts slowly. Over a few years the real change is often smaller than the map's own error. A map fine for planning lime can be useless for proving carbon gain, and an auditor will say so.
None of this makes the maps worthless. It gives them a range of plausible values rather than a verdict. Ask any supplier for the uncertainty layer. If they cannot produce one, or cannot explain how it was validated, you have learned what you needed to know.
How to read a digital soil map without getting burned
Before you act on a digital soil map, run through a short checklist.
- Ask where the samples came from. How many, how recent, how well spread? A map built solely on old regional databases will be less accurate for your farm than one with fresh local samples.
- Demand the uncertainty layer. Not the accuracy headline, the per-pixel range. Uncertain zones deserve a field check before you spend money on them.
- Sense-check against what you know. If the map disagrees with your experience of a field, trust your boots first and investigate the difference.
- Match the map to the decision. A map good enough for lime application may not be precise enough for a carbon baseline. Ask what it was built for.
- Treat it as one input. Combine it with local knowledge and a few verification samples where it matters most.
Used this way, a soil map is a decision-support tool instead of a source of false certainty.
Where this is heading
Somewhere good. Static maps are updated once a generation. What replaces them is live: lab samples, field sensors, satellites passing every few days, weather, and crop records, all folded into a picture that updates as the farm changes. Soil information is about to stop being a document and start being a feed.
The models will keep getting better, but the best systems still will not be automatic. They will pair machine learning with soil science, agronomic judgment, and the farmer who has walked that ground for twenty years. Soil is a living system shaped by climate, biology, management, and time, and better soil health is the real goal that these maps serve.
Digital Soil Mapping is not about prettier maps. It is about turning scattered measurements into knowledge you can act on: where your soil is strong, where it is vulnerable, and where a change in management pays. Handled honestly, with its uncertainty on the table, it is one of the most useful tools soil science has produced. Handled as a certainty it never claimed to offer, it will cost you money.
Sources
McBratney, A. B., Mendonça Santos, M. L., and Minasny, B. (2003). On digital soil mapping. Geoderma, 117(1-2), 3-52.
ISRIC World Soil Information. SoilGrids, global gridded soil information.
FAO Global Soil Partnership. Soil information and data.
Zhu, A.-X., Ma, T., Zhao, F.-H., Yang, X., and Xia, Y. (2025). Uncertainty quantification for digital soil mapping, an overview. Pedosphere.
Yuzugullu, O., Fajraoui, N., Don, A., and Liebisch, F. (2024). Satellite-based soil organic carbon mapping on European soils using available datasets and support sampling. Science of Remote Sensing, 9, 100118.
Minasny, B., and McBratney, A. B. (2016). Digital soil mapping, a brief history and some lessons. Geoderma, 264, 301-311.
OpenGeoHub Foundation. OpenLandMap, open global land and soil data layers.