

How can vegetation indices be used to improve crop performance?
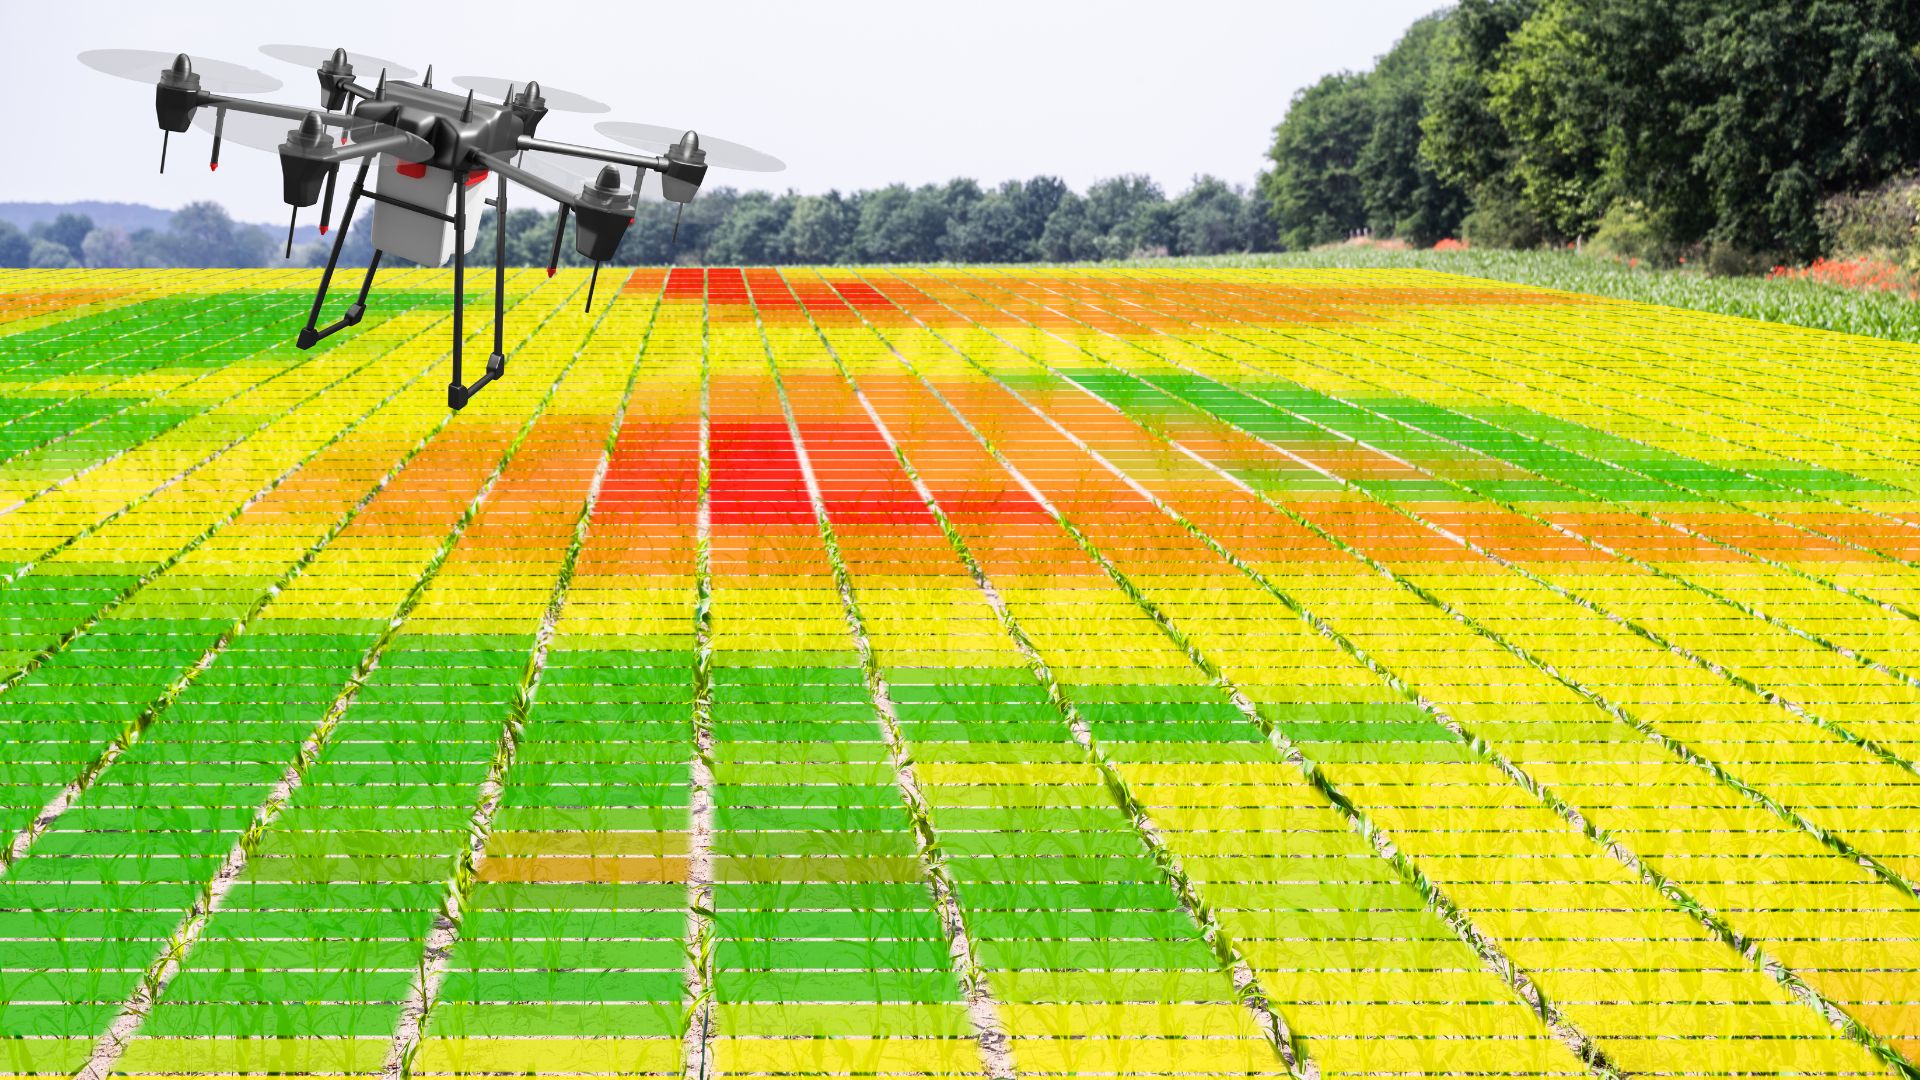
Smart farming practices and precision agriculture have penetrated the agri-food system helping farmers produce and interpret important data related to their crops and farms. More specifically, earth observation from satellites plays a very significant role in the agriculture sector in different ways of the crop. With the images we can download from the satellite, we can manage our crops and use these data in rational movements like monitoring fertilization, controlling pesticide applications, or managing irrigation. This means that we can organize our program depending on the needs of our crop. Farmers are strongly advised to exploit such data techniques.
How does remote sensing work?
Optical satellite sensors measure the solar radiation reflected from targets on the ground. The satellite that we use mostly in agriculture is "Sentinel 2". It gives high-resolution images with 10 m precision and uses multispectral bands, which can be combined to calculate the vegetation indices. We use the term "band" to refer to the layers in an image, such as a satellite image or an image from a digital photograph.
Each channel is sensitive to radiation within a narrow wavelength band such as the blue, green, red, near-infrared, or short-wave infrared band. The term "channel" is used to represent the different colors or light that are used to display an image on a computer screen.
The reflection of radiation by vegetation shows low values in the blue and red bands, slightly higher values in the green band, very high values in the near-infrared band, and low to high values in the short-wave infrared bands (depending on the wavelength).
Sentinel 2 aims at monitoring variability in land surface conditions, and its wide swath width (290 km) and high revisit time (10 days at the equator with one satellite and 5 days with 2 satellites under cloud-free conditions, which results in 2-3 days at mid-latitudes) will support monitoring of Earth's surface changes.
Using vegetative indices for crop monitoring
How can we calculate the vegetation indices?
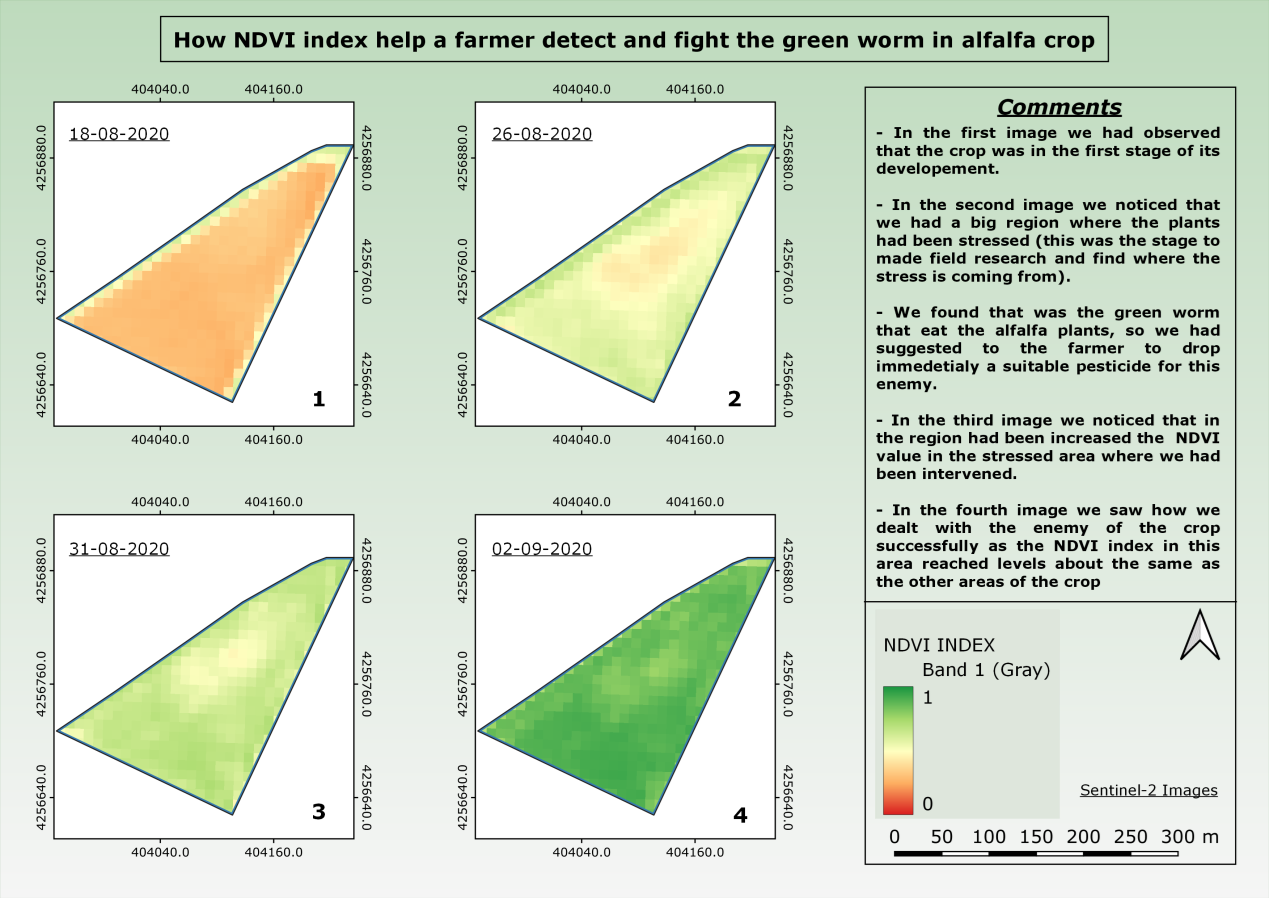
So, the farmer can monitor his crop often and see the improvement of the plants and decide if it is necessary to intervene with suitable actions (following the instructions of an agronomist). In this article, we will analyze the two most important vegetative indices for agriculture: the NDVI and the NDRE.
What is NDVI?
Ndvi (normalized difference vegetation index)
- The NDVI is mainly used to measure the health of a crop (vegetation), determine the density of green (plants) in a specific area (field), and can reflect the moisture stress (drought stress) of a plantation. It is the most used vegetation index in agriculture. It can be derived from satellite (remote sensing) data and is the ratio of near-infrared (which vegetation strongly reflects) and red light (which vegetation absorbs). NDVI ranges from -1 to 1. The NDVI takes negative values indicating water of clouds. Positive measurements very close to zero may indicate bare soil, while the higher the value, the more dense and green the plants (area). The maximum values of the index are usually obtained in tropical forests when the plants are at their maximum growth stage.
NDVI = (NIR-RED)/ (NIR+RED)
What is the NDRE index?
NDRE(normalized difference red edge index):
- The NDRE measures the amount of chlorophyll in the plants. We can calculate this index using a combination of the Near-Infrared (NIR) band and the Red edge, which is the range between Nir and the Red band. The index can be obtained from spectacle band images, and the best time to use it is during the mid-to-late growing season when plants have reached maturity. At this point, the plants have accumulated higher amounts of chlorophyll. Due to the poor penetration of red light, other indices would be less effective.
NDRE = (NIR-RED EDGE)/ (NIR+RED EDGE)
What are the advantages of using these indices in agriculture
They can help the farmer:
- Improve the growth and yield of the crop.
- Identify the sick plants (by diseases or/and pests).
- Improve plant irrigation management.
- Manage the fertilization of the plants (especially nitrogen).
- The farmer can foresee or/and prevent future problems-stresses for the plants.
Generally, the indices are used to find the regions in a field where the plants have been stressed and there is more poor growth. It is important to remember that they do not tell us what exactly the problem is. This will be founded by the farmer and the agronomist when interpreting the data and comparing different areas (to each other or with a model). The advantage of this is that we know the spots where the plants are stressed, so we must specify our detection in these regions.
In the layout below, we can see an example of an alfalfa crop that had a stressed area caused by the green worm and how the NDVI vegetation index helped us successfully detect and face it.
Conclusion
This article introduced remote sensing using satellite images (sentinel 2 satellite) and saw vegetation indices, and we presented an example of how the NDVI index can be used in agriculture. Remote sensing can be very useful for farmers and help them improve how they grow their crops. It can help them find problems they can't see in the field and deal with them immediately. Also, by using remote sensing, they can reduce pesticides and target the areas of the field where they need to intervene. For the effective use of remote sensing, it is essential to have an agronomist who can advise according to the stages of the crops and their needs. In addition, it is important to combine the vegetation indicators with the meteorological data of each region.
References
- https://www.sciencedirect.com/topics/earth-and-planetary-sciences/normalized-difference-vegetation-index
- https://www.mdpi.com/2077-0472/13/3/707
- https://www.researchgate.net/publication/337193427_Comparison_of_NDVI_and_NDRE_Indices_to_Detect_Differences_in_Vegetation_and_Chlorophyll_Content
- https://www.usgs.gov/
- https://ipad.fas.usda.gov/cropexplorer/Definitions/spotveg.htm