Soil and plant analysis and field observations

Maps and guidelines for crops and local soil types can help focus on relevant issues. Soils are classified into various systems, classes, and subtypes based on their origin and lasting properties. Other maps are being made too of likely nutrient deficiencies and pH in different regions or/and soil types. However, this can vary even more over short distances and time, e.g., due to fertilizer use, erosion, sedimentation, etc. Learning what information to look for and using local observations is essential. Recent international soil maps, e.g. for Africa, and their explanations are freely available from the EU [1]. For some countries, maps for nutrient availability and pH estimates are available to combine with other observations.
Soil analysis methods, sampling, and observations
Soil analysis indicates the total and/or the within-season plant available nutrients and acidity (pH) in the top or subsoil. Soil texture and organic matter analysis may be included for extra costs roughly established by, e.g., testing moist soils’ ability to be formed like a role or a ring (texture) or looking at its colour. Dark soil indicates more organic matter unless it is due to highly swelling and shrinking black clays in areas with Black Cotton Soils (in USDA classification) and named Vertisols (in FAO/UNESCO classification). They also tend to be high in nutrients but may be nitrogen deficient.
Like plant analysis, soil analysis can be expensive. However, it may be even more expensive not to perform one. The following text is a guide to selecting and sampling for such analysis while performing most tests are usually made by specialized laboratories. Field kits are available on the market, but the methods may be secret, despite they must be compared to available tests and experience. Different extraction methods can give very different results because only somehow relevant fractions are extracted of the total content –, particularly for available phosphorus (P) and pH. The pH of cation extraction is also important. Likewise, differing crops has widely differing requirements, e.g., vegetables are very demanding, particularly when young. Total content is only used routinely for organic matter and nitrogen. A recent cheap method is based on estimating nutrient availability or total content for many nutrients from the reflection of mainly infrared light (IR) to soil samples. However, it is not reliable for at least the important available-N or -P, or pH.
Soil testing for nitrogen is costly and complicated since it depends on more or less stable organic nitrogen and on directly available, rapidly changing mineral nitrogen (ammonium=NH4, and nitrate=NO3). Often, much money can be saved by only testing for a few nutrients, but several elements may be tested with a few same extraction methods and price groups. An alternative indication of N-availability is how healthy, dark, green, and big the mature, lower leaves are. Like most nutrients, it is also an indicator of N-supply, how much (real) dark organic matter the soil colour appears to have.
Soil problems will usually affect parts of the field gradually with several plants affected just beside each other. In contrast, diseases or lack of nitrogen-fixing bacteria may affect plants here and there but not their neighbours. Analysis for micronutrients is not usually necessary if no symptoms occur on younger leaves. If particularly micronutrient-demanding or sensitive plants are to be grown, that can be a reason to test. Likewise, particularly iron (Fe) and Zinc (Zn) nutrition quality can be considered, as deficiencies are common, and local tendencies to deficiencies for soil types (pH, organic matter extremes, drainage). Soil maps with estimates of plant nutrient deficiencies are rapidly improving, e.g., for Africa [1], but understanding variation within short distances is essential too. E.g., eroded areas are less fertile than where nutrients are accumulated from sedimentation, homesteads, burning, forests, livestock, etc. Fertilizer and crop history matter. Also, the most important properties are usually the biological availability of N and P and soil pH. Unfortunately, these are not estimated well by new cheap IR or X-ray radiation methods without wet-chemistry extractions of bio-available nutrients.
Some recommend systematic sampling in a fixed grid pattern. It should be combined with walking a few meters of zigzag to prevent sampling from the same row of crops or fertilizer band. Several subsamples should usually be mixed in a bucket and combined samples to analyse taken out. However, the average result is increased by fertile spots and may hide deficient ones.
Fertility patterns within fields are important to consider, but physical causes can be a part of the variation (water, air, texture, shelter, shade). Looking at the subsoil and roots is essential. It can make sense to compare a big infertile part of a field using a combined sample with a fertile part.
The topsoil (ploughing or hoeing layer) is the most important for nutrient analysis, but subsoil can be at least as necessary for pH and texture analysis. However, these may be estimated mainly by the farmer, using simple means, e.g., using a pH indicator paper with a suitable range correctly (e.g., 1:2.5 soil to water volume ratio soaked, stirred, and settled over 45 minutes). Stunted (short) roots of sensitive plants or extractable Aluminium (Al3+) are also essential to consider for pH problems. Guidelines from the analytical laboratory should be considered, e.g., drying, crushing, and sifting the sample correctly first can save costs.
Soil analysis units and interpretation of the analysis results
Units for cations and cation exchange capacity (CEC). These units are used for cations competing (exchangeable) for the same surfaces on clay minerals and organic matter. Cations include positively charged Potassium, Calcium, Magnesium, Sodium, Aluminium (reported as Al3+), Ammonium, and Hydrogen (H+ or more correctly H3O+). These are today usually reported based on their electric charge in milliequivalents per 100 grams of soil (meq/100 g = meq *100 g-1). It gives the exact figure as the older unit centimoles of charge per kg of soil cmol (+)/kg.
If the content of available or needed nutrients in the topsoil is calculated, it can be expressed as 1 kg ha-1 = 1 kg per hectare = 1 kg per 100 m* 100 m = 0.89 pounds per acre (lbs/acre). Some laboratories assume 20 cm topsoil and some 30 cm.
Also, some still express fertilizers elements in units as theoretical oxides like K2O and P2O5 rather than elements (K and P). To convert K2O to K, multiply with 0.826. For P2O5 to P, multiply with 0.437.
The extractants used affect how much nutrients are extracted; some extractions are at the pH of the soil, and some are stabilized (buffered), e.g., pH 7.
A change increase in one pH unit represents a ten-times reduction in H+ concentration because “p” means the negative logarithm of 10 (pH= -log10[H3O+]).
Adequate and optimal nutrient levels and ratios vary much with crop species, variety (cultivar), the stage of the crops, and tend, e.g., to be high for young vegetable crops. A high amount of major cations may reduce the uptake of other cations.
Plant tissue analysis
Foliar nutrient analysis shows what crops take up per unit of the dry weight of the type of leaves, plants, and time sampled. A sampling at the maturity level(s) that is comparable with detailed studies is important because nutrient concentration falls with maturation and senescence (ageing). Accordingly, analysing nutrient ratios can be relevant.
The N:P ratio is often about 10:1 in green tops if neither N nor P is deficient. However, it can vary significantly, and most P is found in young parts with rapid cell division, while most N is in green leaves.
Other nutrient ratios in healthy plants vary even more. Also, total nutrient uptake or dry matter yields are important, too, because several nutrients could be deficient, and crops remain immature and high in concentration of most nutrients. For some crops, systems based on nutrient ratios have been developed (e.g. major fruit trees). Sampling early in the growing season may be used for correction of the crop, but data from later sampling can give information that leads to soil nutrient adjustments to prepare for the next crop season. A late sampling is, e.g., from the leaves around maize cobs (called ear leaves) where nutrient concentration and sometimes ratios were the best predictors of yield, and no clear correlations were found in other cases. Therefore, visual information and broad understanding are also important. [2]
Manures can also be examined visually or tested; see the article here by Mandal (2023) on “organic manure and recycling.
Contamination of samples with soap can add Sulphur, Phosphate or Boron for both plant and soil sampling. For analysis of micronutrients, it is important to use tools of plastic or at least simple, plain iron, to prevent any other metal contamination of samples, Figure 2.
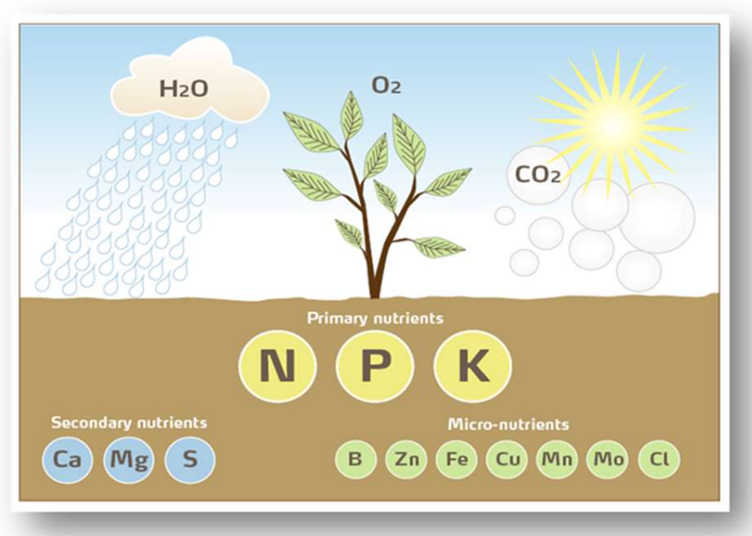
Figure 2. Plant nutrients incl. essential mineral primary (Nitrogen, Phosphorus, Potassium (K)), secondary (Calcium, Magnesium (Mg), Sulphur) and micronutrients (Boron, Zinc, Iron (Fe), Copper, Manganese (Mn), Molybdenum and Chloride). Essential nutrients are necessary, but before they limit crop growth, adding even will not increase growth. Source: Fertilizer Industry Handbook 2022 with notes (yara.com)
Field observations
Understanding the soil fertility variation in a field, farm or landscape can help with the proper analysis and treatments. Different field histories (crops, manuring, fallows, ‘weeds’ etc.) influence soil fertility, as well as which parts were eroded, and which were enriched with sediments. Fast-flowing water deposits nutrient-poor sand, slow-moving silt, and steady clay. This influences soil depth and water holding too. Poorly drained areas with much silt and clay and little run-off may have bluish rather than reddish clay except for aerated zones near pores left after worms and dead roots. Soil textures can also be compared within a field because big particles settle first after suspension in water. Soaking soils for at least 30 minutes and steering them in glasses can indicate texture composition, but tropical clays can form relatively stable sand-like aggregates.
Trees can harm crops with competition and benefit them as windbreaks, habitats for usually beneficial organisms, and sources of manure, particularly if they fix nitrogen from the air (N2), drop suitable leaves, or have been growing for a long time. Near traditional farmhouses, soil tends to be highly enriched by human and livestock waste and highly manured vegetables and fruits. The areas traditionally form part of in-fields enriched with manure and ash from livestock feed and fuel coming from depleted out-fields.
Indicator plants
Plants particularly sensitive to nutrient deficiencies can be used as indicators. For example, broccoli can be used in a field as an indicator for Molybdenum deficiency which is expensive to test for. Similarly, maize can be used too, as visual symptoms are relatively easy to see and distinguish from, e.g., infections. However, there might be a yield reduction before visual symptoms are visible or widespread. Even for maize, some genotypes tend to be more purple, which P-deficiency can cause too.
Plants sensitive to some micronutrient deficiencies or acid soils can also be grown as indicator plants, but cultivars vary within species. Likewise, soil management and constraints can affect symptoms. Growing plants for testing in containers (e.g., bags) is often tricky – particularly with normal soil tending to compact when watered and flooded.
Plant observations can be combined with comparable, replicated, and relevant experiments.
For deficiency symptoms, see other illustrated articles on plant nutrition by Mandal at Wikifarmer Library for a summary and specific nutrients, and see e.g. the site of the laboratory CropNut, which also contains more info on nutrient analysis.[3] Illustrations of deficiency symptoms in maize leaves, stems and cobs (and alternative causes) can be found in pocket guides by e.g. African Plant Nutrient Institute. [4]
Soil acidity or alkalinity (pH) observations and problems
Stunted roots indicate the main problem with low pH better than pH figures alone because low pH (high hydrogen ion concentration (or ‘activity’) is rarely a big problem in itself. It is the combination of high levels of exchangeable Aluminium (Al3+) and a pH, e.g., measured in the water below 5.5 to 4.5, depending on the species and cultivar within the species.
The pH measured in pure water varies quickly. The pH in highly dilute (0.01 Molarity, M) CaCl2. extracts resemble the soil solution and are less unstable and lower. However, the pH in 1 M KCl best indicates the longer-term acidity and is normally the lowest. The pH difference between the methods varies less predictably than some writers claim, but stronger extractants can usually cause about 0.3 to 1,5 reduction each in measured pH. If the pH is in a range where it is essential for decision-making, ideally, more than one extractant should be used. Relevant published pH results and guidelines may also have been made, with other extractants than offered in local standard tests. Mandal (2006) developed an extraction method where all three methods could be used after each other in the same sample with excellent results. [5]
As an indication of combined acidity and aluminium toxicity of elongation of sensitive crop roots. One can also compare how roots grow, e.g., germinating maize or common bean with and without mixing lime (or 1% wood ash if that is easier) into the soil, e.g., 2 weeks in advance. Low root length can damage the uptake of phosphate in some soils, but phosphate binding to the soil will not increase as much as many believed because it mainly depends on stronger bonds, specific bonds that ion exchange. Yellow clay soils in the humid tropics are particularly likely to be high in exchangeable aluminium. Sometimes, Manganese (Mn) toxicity also occurs in acid soils.
Outdated guidelines can promote over-liming, and the topic is complex. For an up-to-date overview of soil pH concerning nutrients, see, e.g., a US university extension site: [6] Increasing the pH, generally reduces the availability of micronutrients except for it increases the availability of molybdenum (Mo, the available molybdate anion MoO42-). Acid soils can also be low in micronutrients, but it does not mean lining helps it for other micronutrients than Mo. For example, Boron (B, borate anion types) deficiency is most likely to occur in soil with a pH below 5.0 and above 6.0. Micronutrients tend to give deficiency symptoms to the younger parts first, except Mo deficiency because it damages nitrate us and nitrogen fixation first. Micronutrient deficiency symptoms can be seen here. [7]
High pH and salt accumulation are only common for some fertilizers placed too near seeds or where in some dry areas where salts are not washed out in any season because of irrigation water and/or poor drainage. It will only be briefly introduced. Electrical conductivity (EC) is the common indicator of the total content of soluble salt in water. The composition of salt matters too, and, e.g., sodium chloride (NaCl) is relatively toxic. Important factors also include units used, the dilution ratio of extracts, the sensitivity of crops, and irrigation methods. If salts cannot be tasted with the mouth in irrigation water and/or soils are leached seasonally, then testing for salinity problems may not be needed for local use. However, the pH may in some drier areas be high, and salt accumulation can be seen in the landscape, e.g., as black or white alkali soils or e.g., level of sodium and chloride too high. Exchanging Na+ with Ca2+ is one of the solutions. See more in the article my Mandal on nutrient elements. [8]
References
[1] https://esdac.jrc.ec.europa.eu/Atlas
[2] Kovács P, Vyn T (2017): Relationships between Ear-Leaf Nutrient Concentrations at Silking and Corn Biomass and Grain Yields at Maturity (Open Access). Agronomy Journal 109: 2898-2906
DOI: 10.2134/agronj2017.02.0119
[3] Nutrient Deficiency Guide For Crops – Cropnuts. Seen 2023.
[4] : APNI (2020): Maize – Crop Scout Pocket Guide. African Plant Nutrition Institute, APNI.net.
[5] Mandal T (2006): A new pH measurement method and effects of wood-ash on a Kenyan Ferralsols soil on pH, salinity, phosphorus bio-availability, and tree legume growth. Report submitted in partial fulfilment of the requirements for completing the PhD course: ‘Analytical and Physical Chemistry’. Department of Natural Sciences. Royal Veterinary and Agricultural University (Now: University of Copenhagen. DK-Frederiksberg. 72 pp.
[6] FS-1054 Soil pH and Nutrient Availbility_Update_12_2021.pdf (umd.edu)
[7] Deficiency Symptoms of Micronutrients in Plants (biotecharticles.com)
[8] Mandal T (2023): Positive ions (cations) incl. K+, Ca2+, Mg2+. Wikifarmer Library.
Sustainable Plant Nutrient Management (SPNM): An overview
Sustainable Nutrient management: Introduction to concept, strategies, and principles
Nutrient conservation and cycling
Mineral fertilizers (including ash) and sustainability
Biological Nitrogen Fixation and seeding Legumes for Soil Fertility
The importance and management of Phosphorus (P) and Potassium (K) in plant production
Ion charges and secondary (=meso) nutrients: Calcium, Magnesium and Sulphur
How important are the Micronutrients for plants
Soil and plant analysis and field observations
When are approaches to Plant Nutrient Management actually Sustainable?